by Nick | Nov 30, 2015 | Maps
For this project, I guided a first time web mapper in how to present the data visually and how to implement that presentation in code. The map uses Leaflet and D3 to provide interactive visualization of California economic data on agriculture at multiple spatial...
by Nick | Oct 11, 2015 | Maps
I built a web map viewer for the PISCES California fish species range data. The data is served by ArcGIS Server and the viewer is a mix of a coworker’s custom map viewer that uses the ArcGIS API and site-specific javascript coded by me. Launch the Map...
by Nick | Feb 27, 2015 | Code, Maps
PISCES is a set of ArcGIS tools and data for managing and analyzing the ranges of California’s 133 native fish taxa. Data is stored as a standard relational database, increasing the power over many typical GIS approaches, and allowing for a powerful mapping...
by Nick | Jul 14, 2014 | Technical
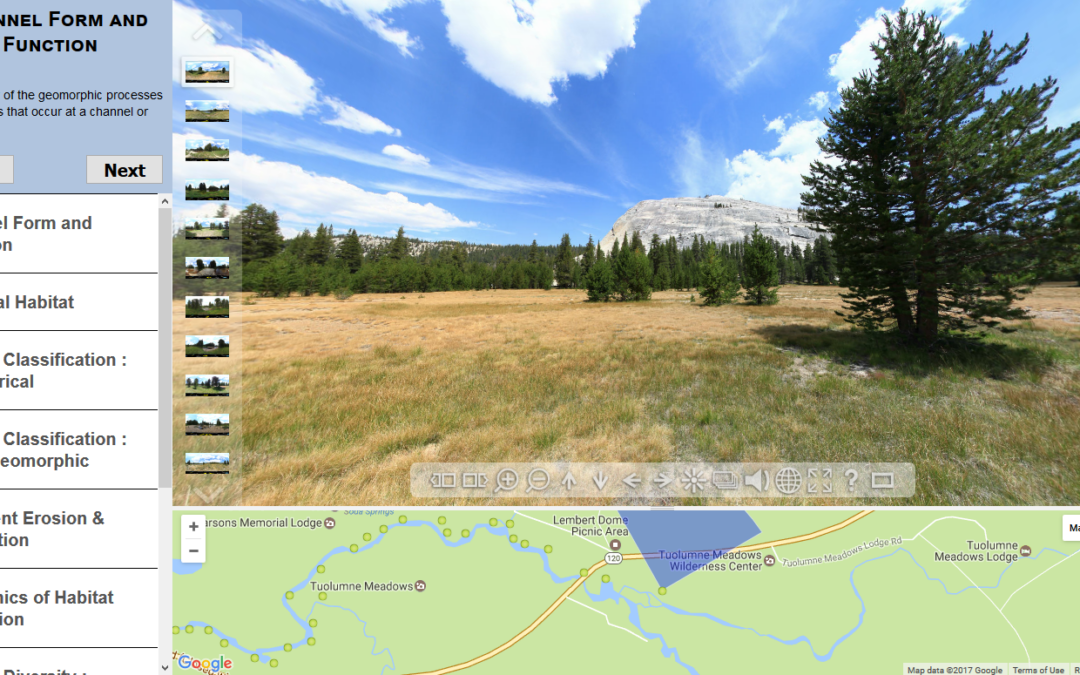
As part of a class where students gained extensive experience in the field, my colleague Sarah Yarnell led a team of researchers at the Center for Watershed Sciences that developed a virtual field trip as a pre-field trip teaching tool, and a way to expose the public...
by Nick | Apr 30, 2014 | Talks and Presentations
In this presentation, given at “Groundtruths and Airwaves”, an event put on by the UC Berkeley Center for Information Technology Research in the Interest of Society (CITRIS), I talk about some of the work we had been doing at the Center for Watershed...
