
Sort By Date
-
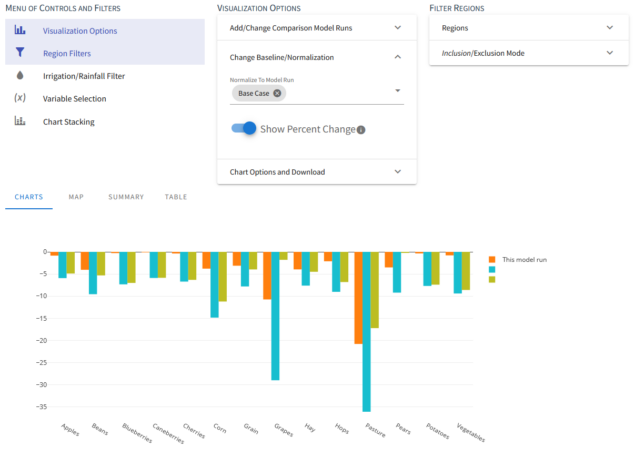 PLAY VIDEOMay 8, 2024OpenAg is a hydroeconomic decision support application that builds on modeling from Josue Medellin-Azuara’s Water Systems Management Lab. Josue conceptualized a decision support application that would allow people to run numerous scenarios for agriculture across a region or state and compare the results. We started with a Python model, which I...
 -
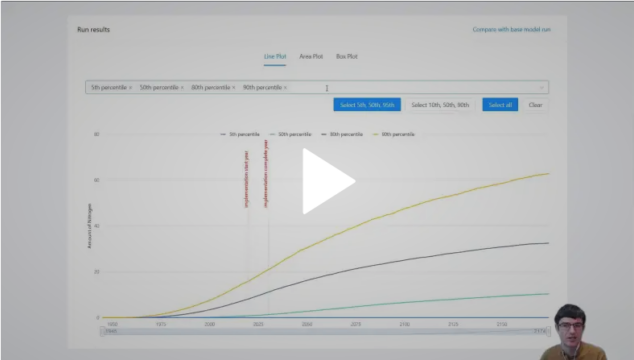 PLAY VIDEODecember 17, 2020I presented a work in progress decision support application for groundwater nitrate contamination based on changes in land use. This presentation was developed for the American Geophysical Union 2020 annual meeting. For more information on the lab this work was done for, Dr. Thomas Harter’s groundwater lab, see https://gwt.ucdavis.edu
 -
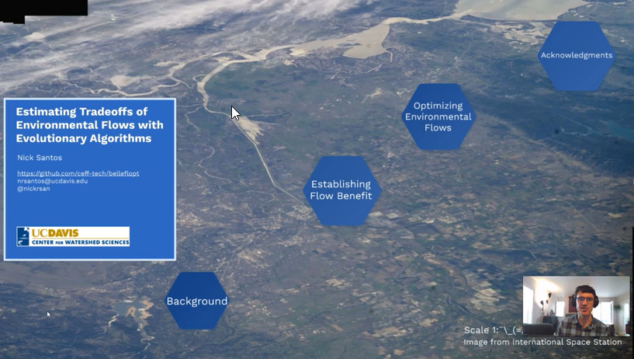 PLAY VIDEOJuly 20, 2020My masters thesis involved work in three areas: Theory and representation of the benefit of environmental flows in a mathematical model Downscaling ecosystem information to the stream-reach scale in order to support estimation of environmental benefit Running an evolutionary algorithm to look at the tradeoff curves (Pareto front) of environment vs economic uses...
 -
 PLAY VIDEOSeptember 4, 2019As part of my master’s thesis, I needed stream-reach scale fish presence information as part of estimating environmental benefit within an evolutionary algorithm. I designed a simple, species-specific downscaling algorithm that translated a species presence within a watershed, based on the PISCES database, into probabilities on stream segments based on...
 -
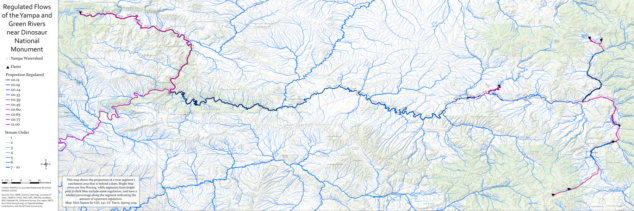 PLAY VIDEOJune 5, 2019For a class, I assessed flow regulation on the Yampa River in western Colorado and the adjoining segments of the Green River in Colorado and eastern Utah. I used a database of dams in the region from the Central Arizona Project and identified other impoundments with imagery and verified via...
 -
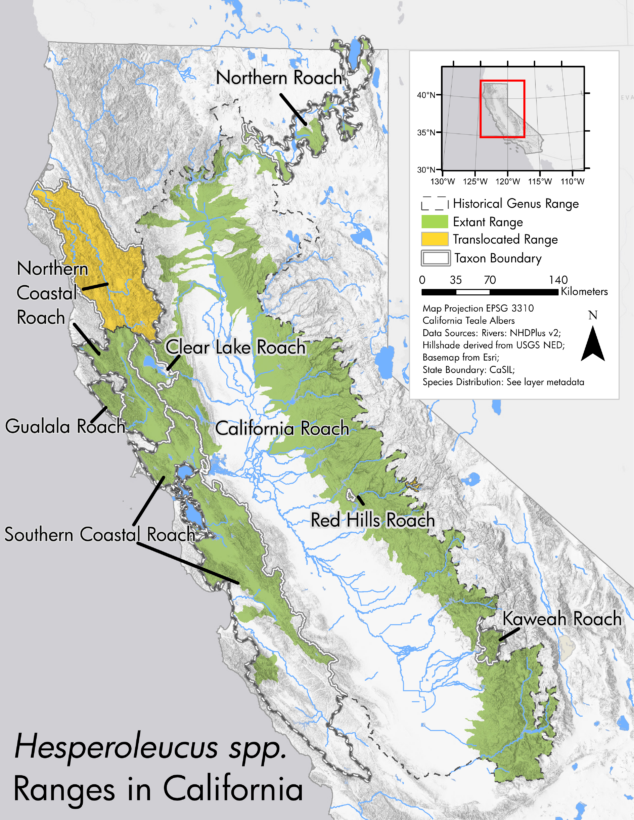 PLAY VIDEOSeptember 27, 2018Final map for publication ranges blended onto hillshade Northern coastal roach range Clear lake roach rnage Northern roach range Southern coastal roach range Mountain whitefish range Northern California coast summer steelhead range In 2017 and 2018, I utilized our PISCES software to generate new maps for CalTrout’s State of the Salmonids II: Fish in Hot Water (SOS II)...
 -
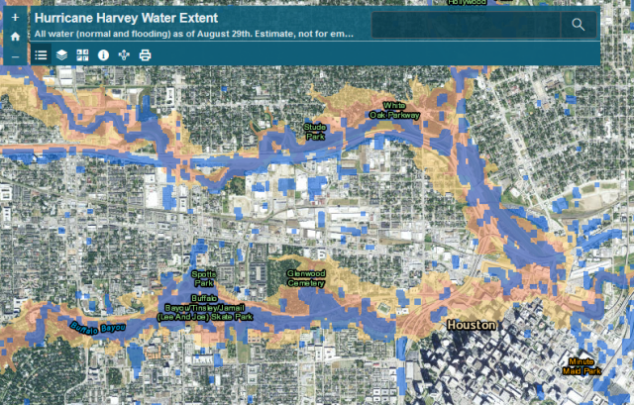 PLAY VIDEOSeptember 1, 2017After Hurricane Harvey hit, the Natural Hazards Research Group wanted to assess the extent of the flooding as it related to mapped floodplains, as part of ongoing research into flood insurance and hazard mitigation nationwide to inform the National Flood Insurance Program (NFIP). To facilitate this analysis, I retrieved Sentinel...
 -
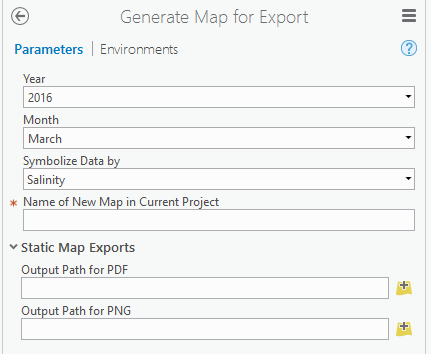 PLAY VIDEOFebruary 2, 2017I write a lot of spatial data analysis code using ArcGIS’s Python package, arcpy. Sometimes we need to automate map generation as part of that work, but with the split of the arcpy.mapping library between ArcMap and ArcGIS Pro, developers had to target two different APIs in order to make...
 -
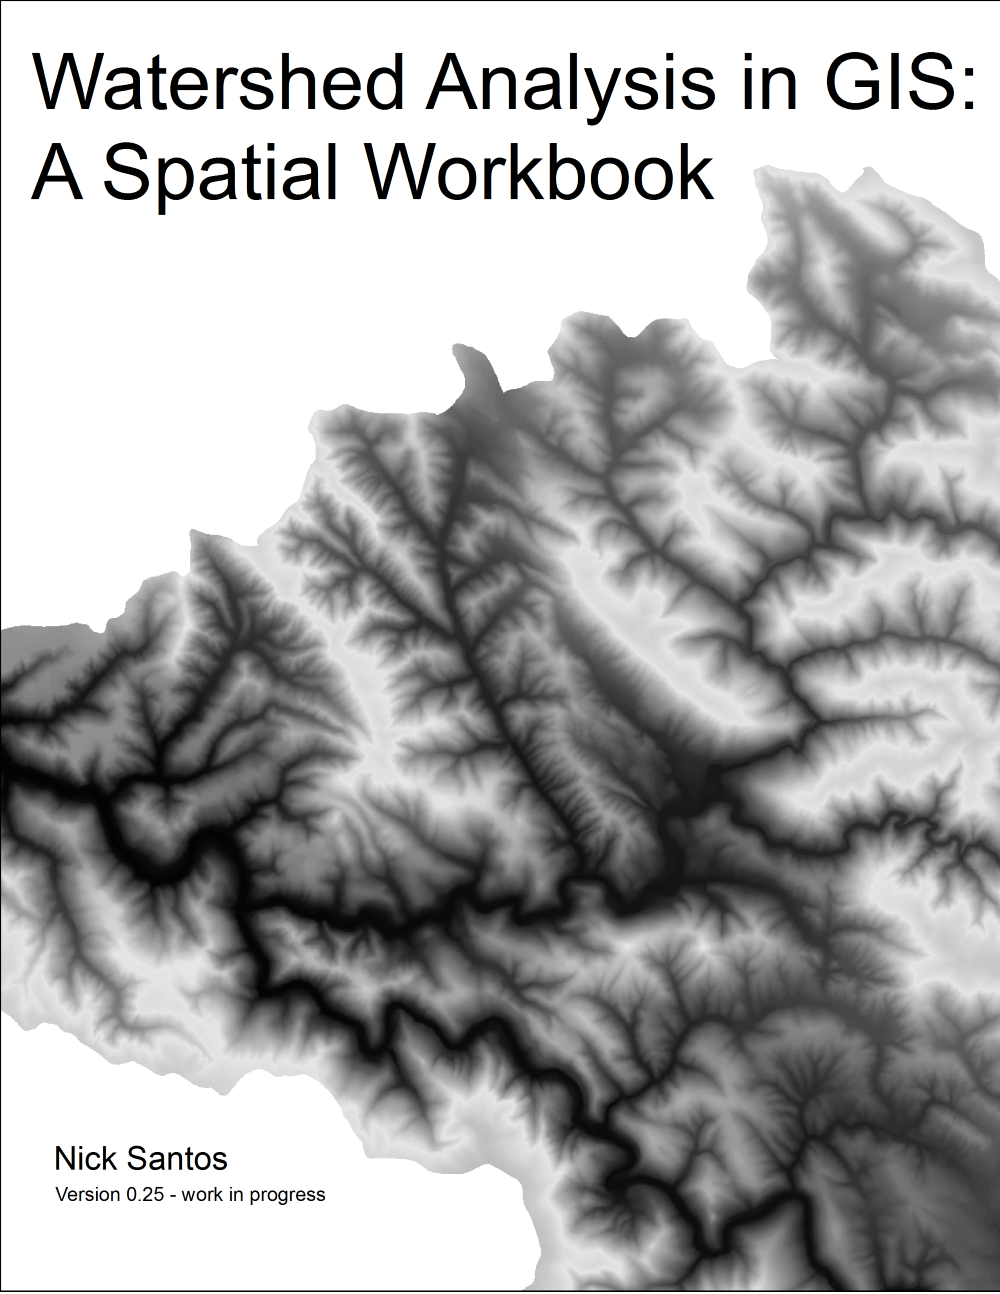 PLAY VIDEOJanuary 14, 2017I receive a number of requests for additional instruction from former students who have taken one class or another. I decided to combine my tutorials for water and ecosystem analysis in ArcGIS into a single book on LeanPub, which allows for work in progress publications, making it easy for me...
 -
 PLAY VIDEODecember 30, 2016I led a team of people using FEMA’s Hazus-MH (Multi-Hazard) software to model flood risk to 2 dozen Illinois communities as part of a larger project to measure perceived vs actual risk of flood in those communities. Hazus can be finicky software, so we tried multiple routes, including Hazus’s standard...
 -
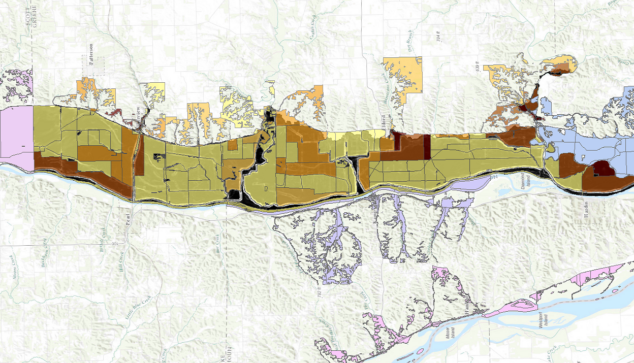
 PLAY VIDEOAugust 19, 2016I created this static map as part of Nicholas Pinter’s Natural Hazards Mitigation Group’s analysis of flood inundation in the 2016 flooding in Baton Rouge, Louisiana. The corresponding interactive map can be found here.
 -
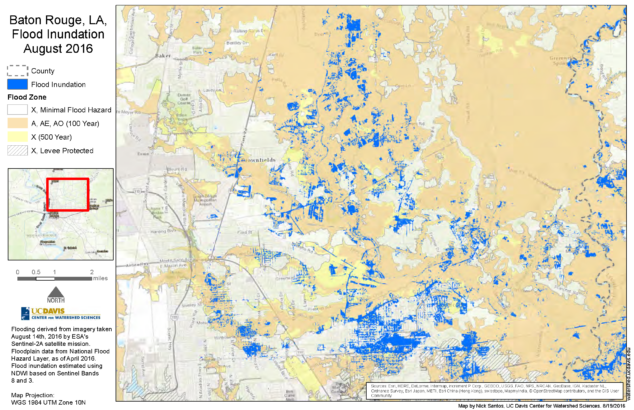
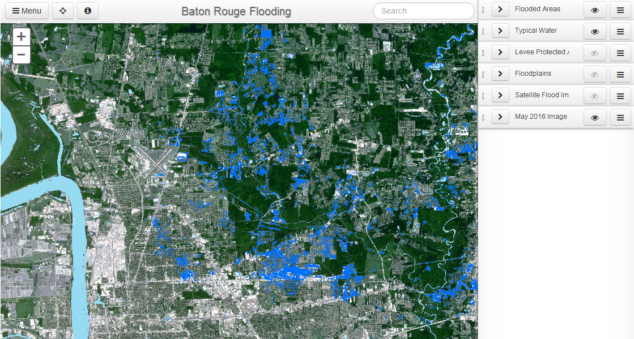 PLAY VIDEOAugust 19, 2016In response to flooding in Baton Rouge, Louisiana as a result of storms in August 2016, we detected flooding using satellite imagery to determine the extent of inundation as it compared to mapped floodplains. The darker blue shows flood inundation on Aug. 14, 2016, compared to locations that typically have...
 -
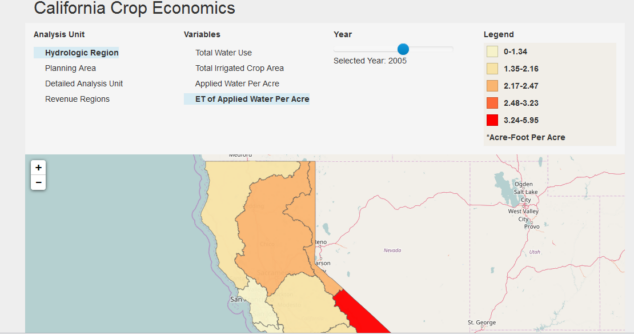 PLAY VIDEONovember 30, 2015http://nicksantos.com/wp-content/uploads/2016/10/crop_economics.mp4 For this project, I guided a first time web mapper in how to present the data visually and how to implement that presentation in code. The map uses Leaflet and D3 to provide interactive visualization of California economic data on agriculture at multiple spatial scales, for multiple variables, across many...
 -
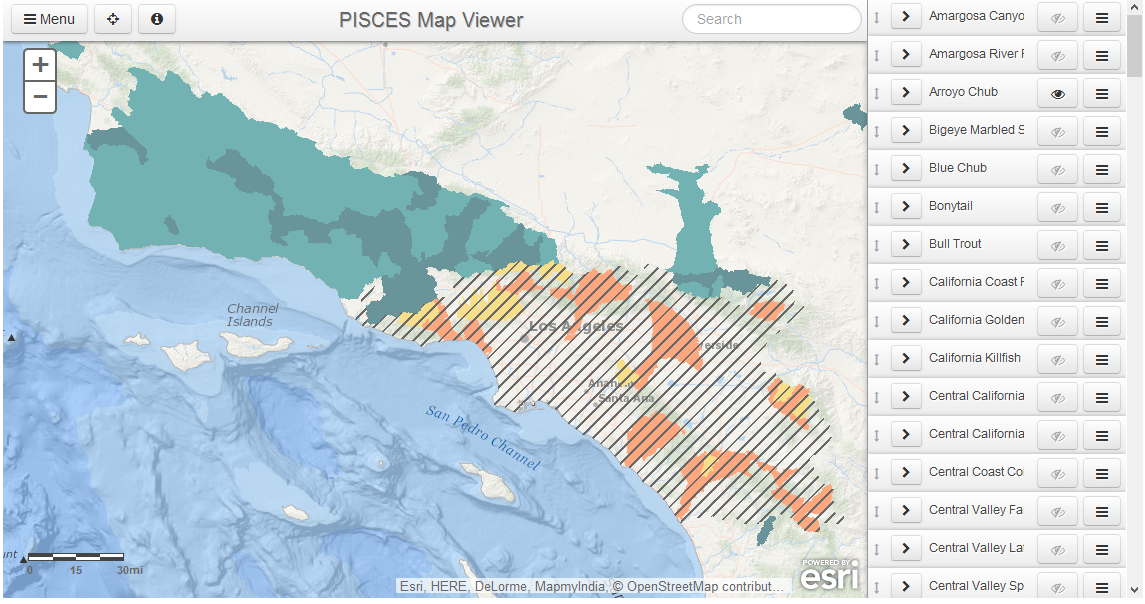 PLAY VIDEOOctober 11, 2015I built a web map viewer for the PISCES California fish species range data. The data is served by ArcGIS Server and the viewer is a mix of a coworker’s custom map viewer that uses the ArcGIS API and site-specific javascript coded by me. Launch the Map Viewer
 -
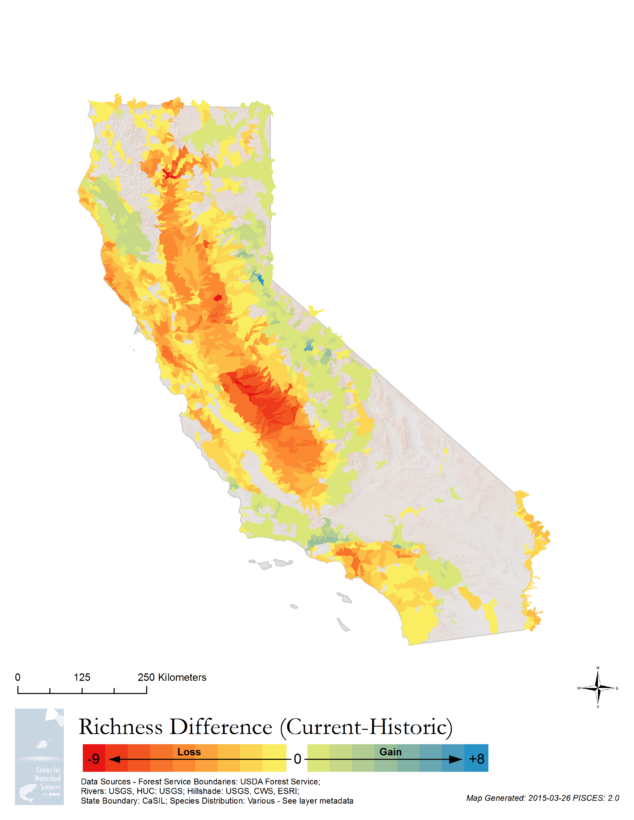 PLAY VIDEOFebruary 27, 2015This slideshow requires JavaScript. PISCES is a set of ArcGIS tools and data for managing and analyzing the ranges of California’s 133 native fish taxa. Data is stored as a standard relational database, increasing the power over many typical GIS approaches, and allowing for a powerful mapping component that summarizes species...
 -
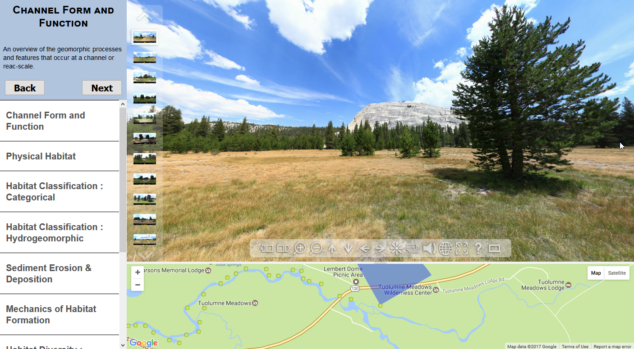 PLAY VIDEOJuly 14, 2014As part of a class where students gained extensive experience in the field, my colleague Sarah Yarnell led a team of researchers at the Center for Watershed Sciences that developed a virtual field trip as a pre-field trip teaching tool, and a way to expose the public to locations that...
 -
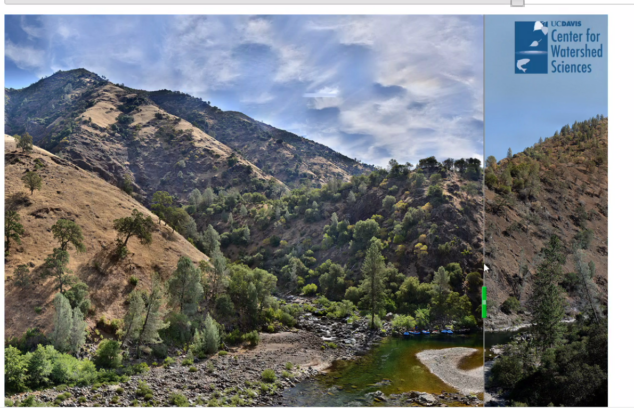 PLAY VIDEOSeptember 30, 2013http://nicksantos.com/wp-content/uploads/2016/10/rim_fire.mp4 The UC Davis Center for Watershed Sciences has long term study sites at the confluence of the Tuolumne and Clavey rivers, near where the Rim Fire of 2013 started. As part of these long term study sites, we captured a gigapixel image of the confluence in June 2013. Center staff...
 -
PLAY VIDEOSeptember 29, 2012Time Lapse Hydrography – Tuolumne and Clavey Rivers 2012 with Temperatures from Center for Watershed Sciences on Vimeo. Our office put out time lapse cameras and data loggers on many rivers in California’s Sierra Nevada Mountains in an attempt to capture what flows result in what types of amphibian habitat,...
-
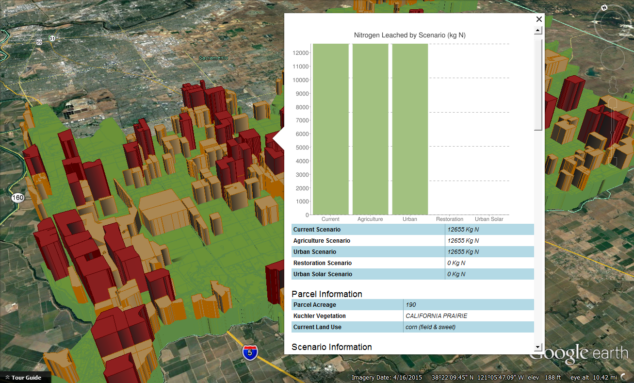 PLAY VIDEOJune 20, 2012The Center for Watershed Sciences had a project to model various scenarios for land restoration in the Cosumnes River floodplain, largely in the context of the Swainson’s Hawk. Toward the end of the project, we wanted to develop a decision support tool to help the grantor better understand the results,...
GIS, Spatial Analysis, and Research
I’m an experienced GIS professional, with a primary focus on decision support, remote sensing, automation, optimization, custom software, and tool development. I primarily work in Python using both open source (gdal, geopandas) and proprietary (arcpy) packages depending on the need and project, but also have experience outside of that environment, having completed numerous analysis and visualization projects using QGIS, Earth Engine, Leaflet, D3, and more.
Many of my projects live primarily as code, with results that aren’t available as maps or cartographic products. You can browse those projects on the Code page and see a selection of other projects below.
Preferred Desktop GIS Tools
- Python with Geopandas, GDAL/OGR, and Xarray
- GDAL/OGR
- ArcGIS
- QGIS
Preferred Web GIS Tools
- Earth Engine
- PostGIS
- ArcGIS Online
- Leaflet
- D3.js
- ArcGIS Server