Image

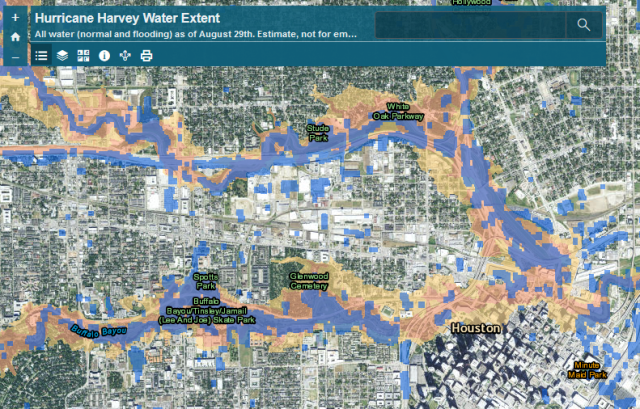
After Hurricane Harvey hit, the Natural Hazards Research Group wanted to assess the extent of the flooding as it related to mapped floodplains, as part of ongoing research into flood insurance and hazard mitigation nationwide to inform the National Flood Insurance Program (NFIP). To facilitate this analysis, I retrieved Sentinel 1 satellite radar data from

I receive a number of requests for additional instruction from former students who have taken one class or another. I decided to combine my tutorials for water and ecosystem analysis in ArcGIS into a single book on LeanPub, which allows for work in progress publications, making it easy for me to combine some of my

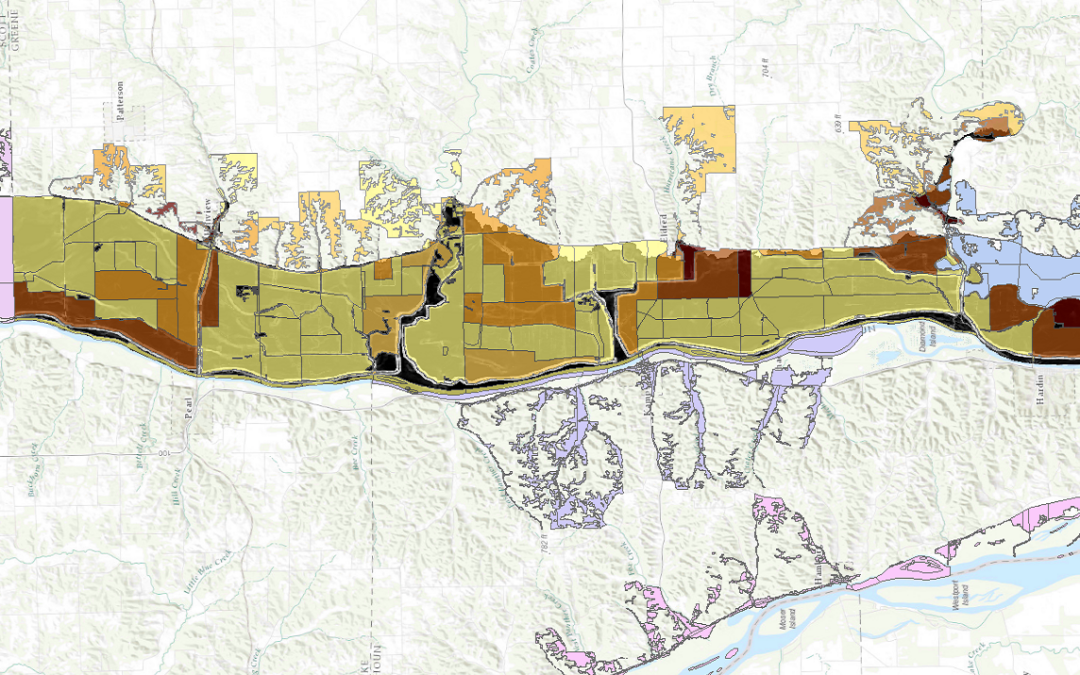
I led a team of people using FEMA’s Hazus-MH (Multi-Hazard) software to model flood risk to 2 dozen Illinois communities as part of a larger project to measure perceived vs actual risk of flood in those communities. Hazus can be finicky software, so we tried multiple routes, including Hazus’s standard modelling methods and a modified

Baton Rouge Flooding 2016 Static Map

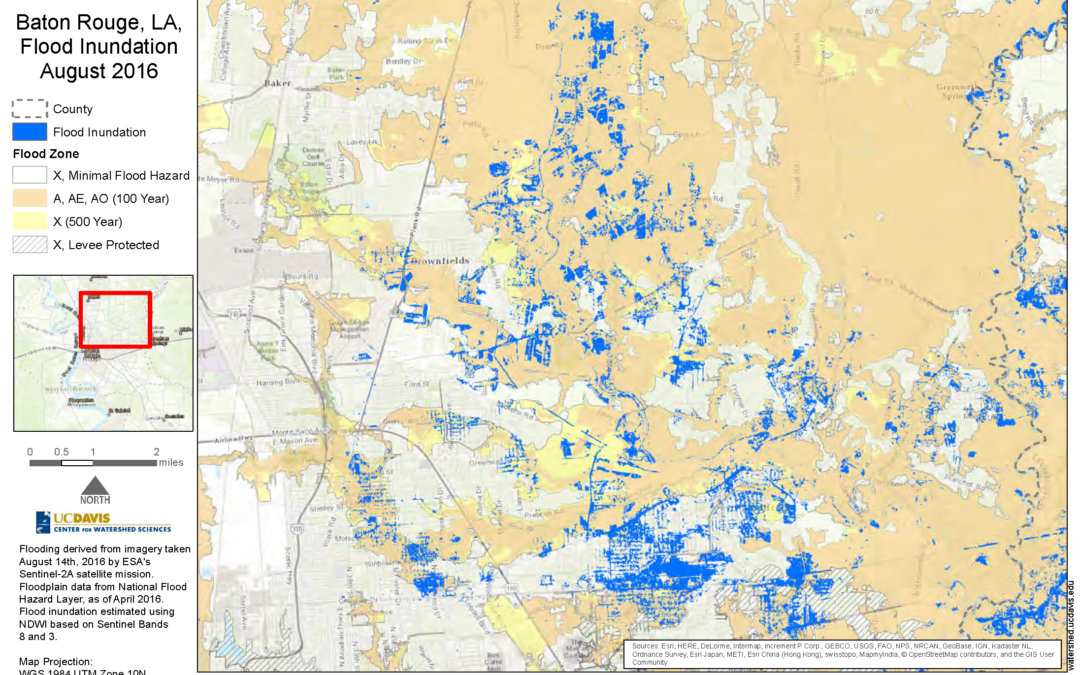
I created this static map as part of Nicholas Pinter’s Natural Hazards Mitigation Group’s analysis of flood inundation in the 2016 flooding in Baton Rouge, Louisiana. The corresponding interactive map can be found here.

Flood Mitigation Potential Interface

I did all of the programming, GIS, and statistical modelling for a multi-phase National Science Foundation (NSF) funded project to determine mitigation potential for flooding in small midwestern towns. The picture above is from a mockup of an interface we designed to allow town governments to use our tool to find suitable locations, out of

PISCES Web Map

I built a web map viewer for the PISCES California fish species range data. The data is served by ArcGIS Server and the viewer is a mix of a coworker’s custom map viewer that uses the ArcGIS API and site-specific javascript coded by me. Launch the Map Viewer

arcpy_metadata documentation screenshot

ArcGIS provides powerful geoprocessing and data manipulation tools in Python, but provides no programmatic access to metadata from the language, meaning that once data is processed, information on the workflow used can’t be attached to the results. To remedy this so that code that produces large numbers of resulting spatial data can attach metadata, I

Showercap website

As part of the organization I started, Environmental Consumer, I built an application to help individuals reduce their time in the shower as part of a hackathon in early 2014. Designed specifically for mobile devices, the application lets you start and stop a timer, accounts for time to dry off, and then gives you a

USGS API Documentation

At a hackathon I helped put on in 2012, I wrote a Python wrapper for USGS’ water data for the nation flow data API that provides native Python objects based on requests for water flow data at USGS gage locations. While the wrapper still works, today, I recommend people use PyUlmo, which provides a more

Vote Climate Change Screenshot

During the 2012 election cycle, I was a fellow with the Roosevelt Institute’s Pipeline program – as part of this fellowship, I built a web application to show electoral support for climate change action to show that climate is an “election issue”. The application allowed visitors to search for their candidate, and if the candidate