
-
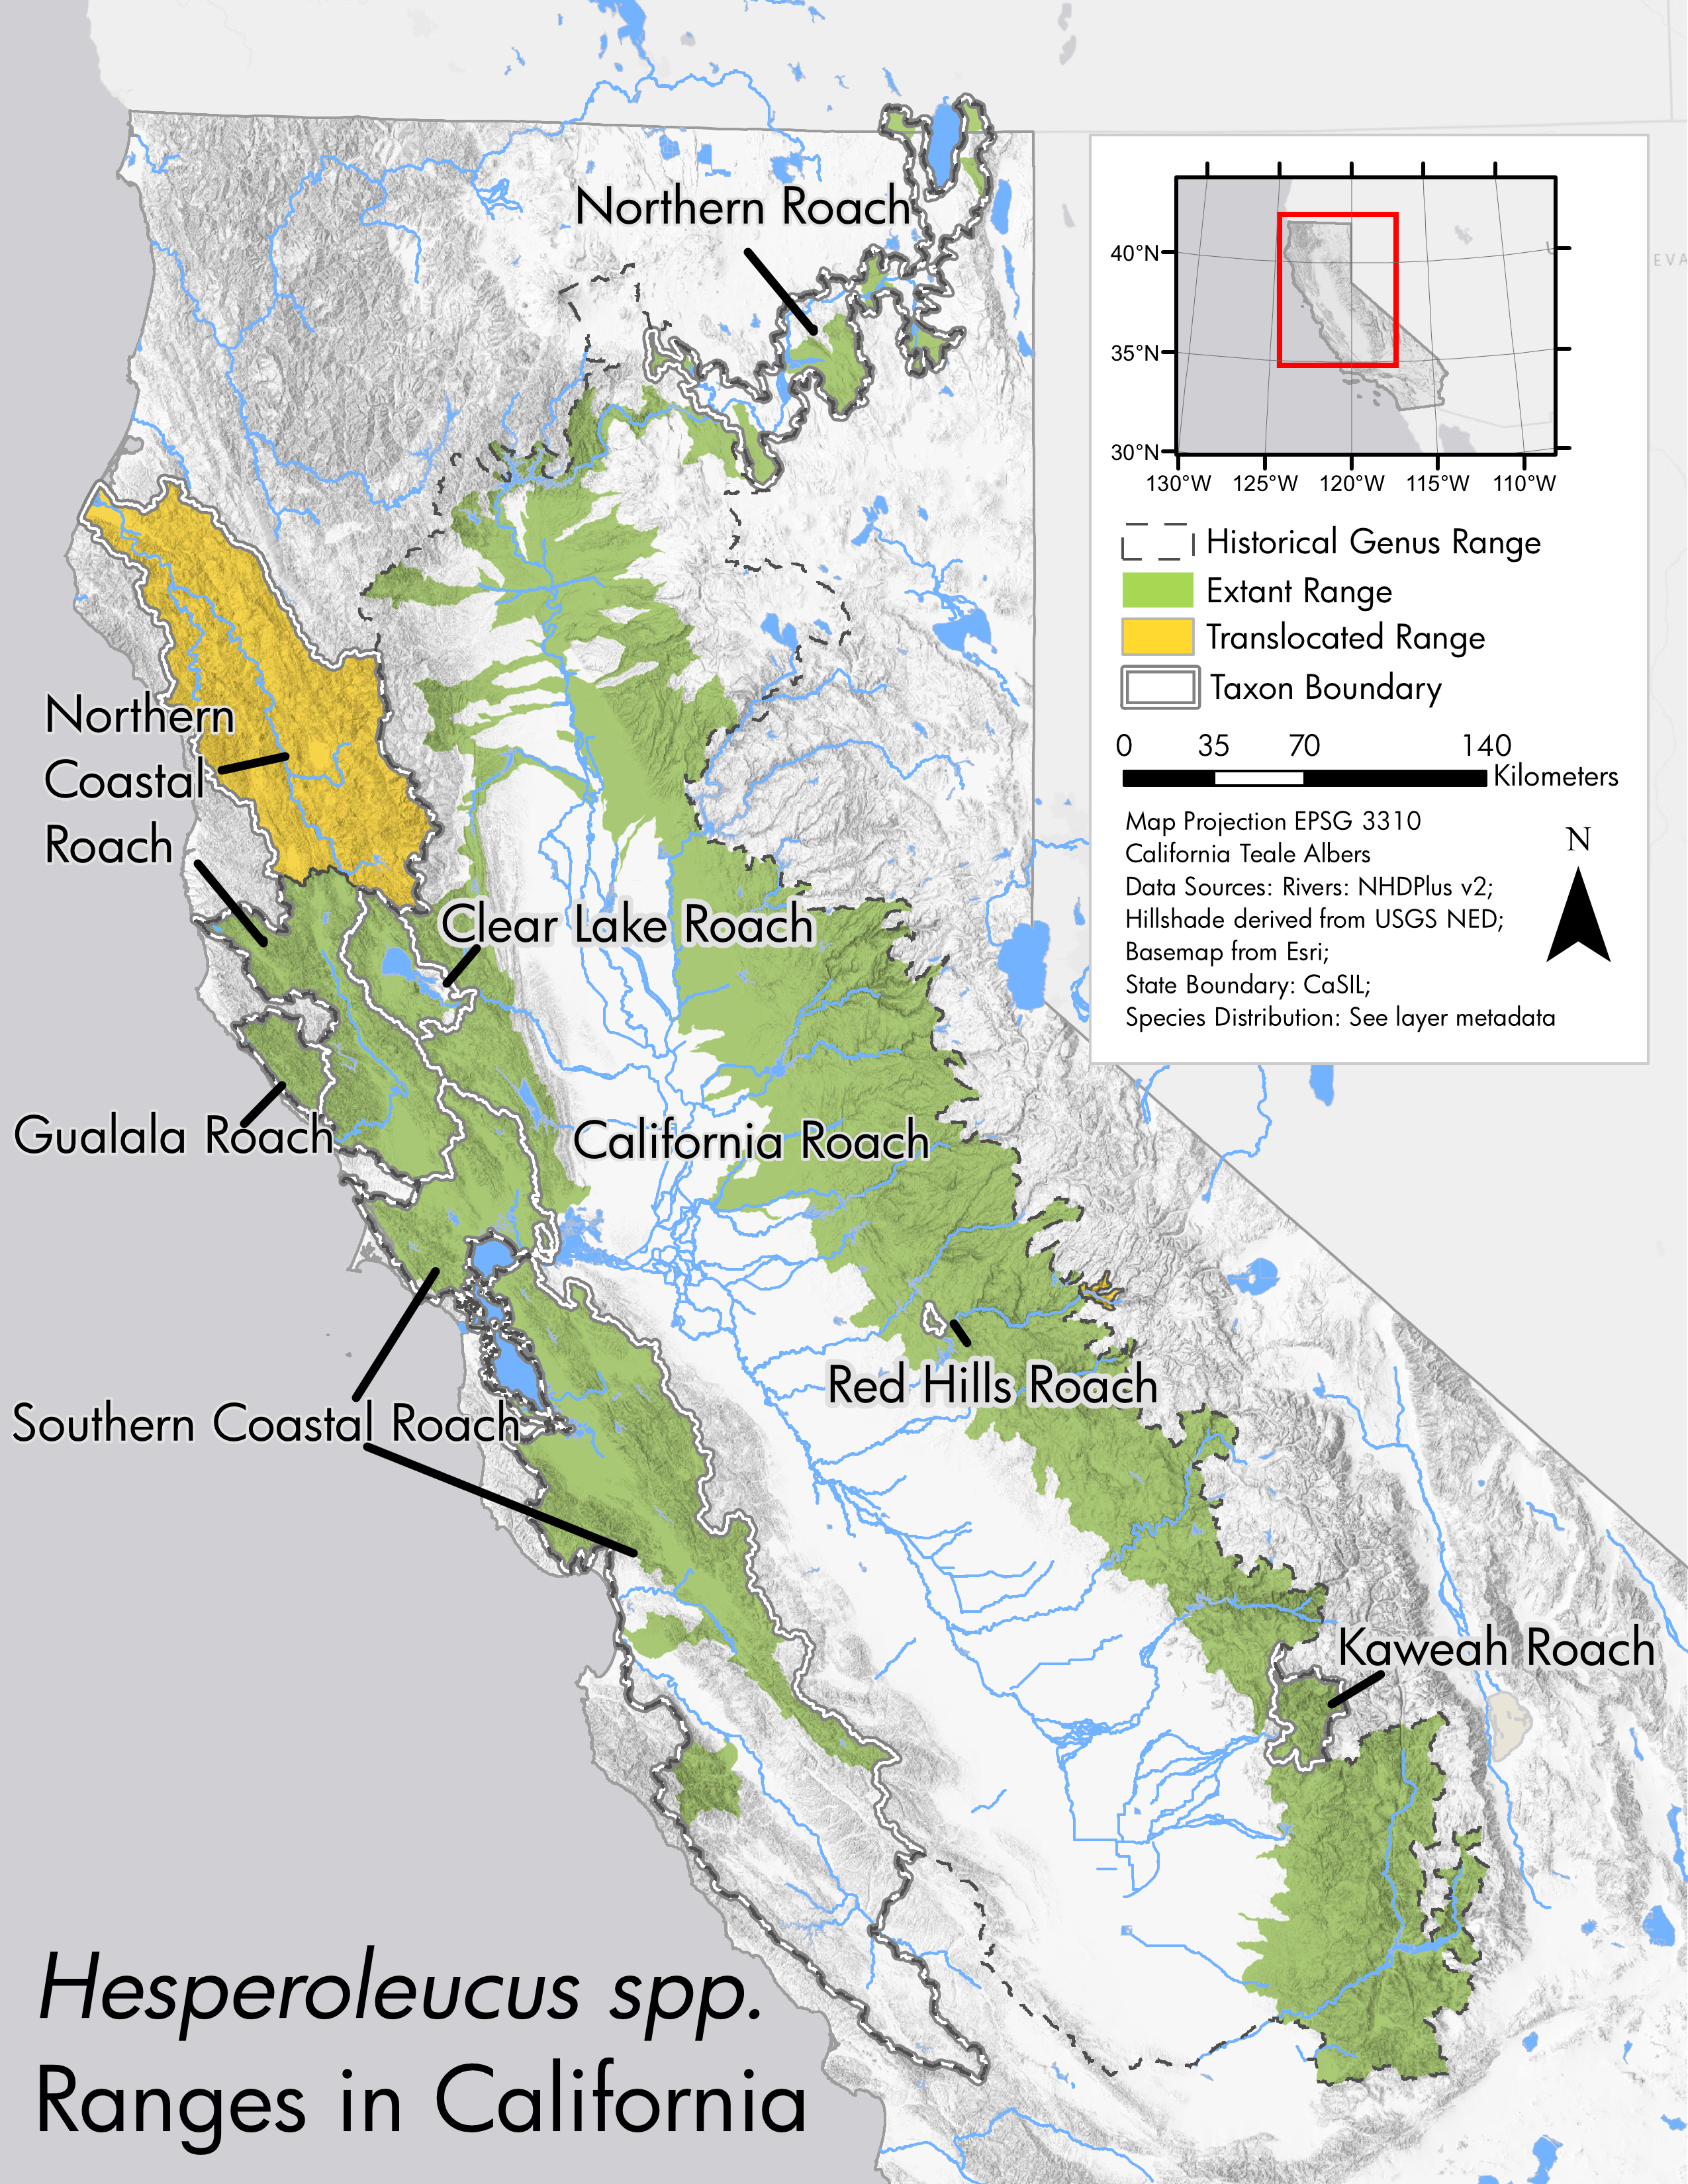
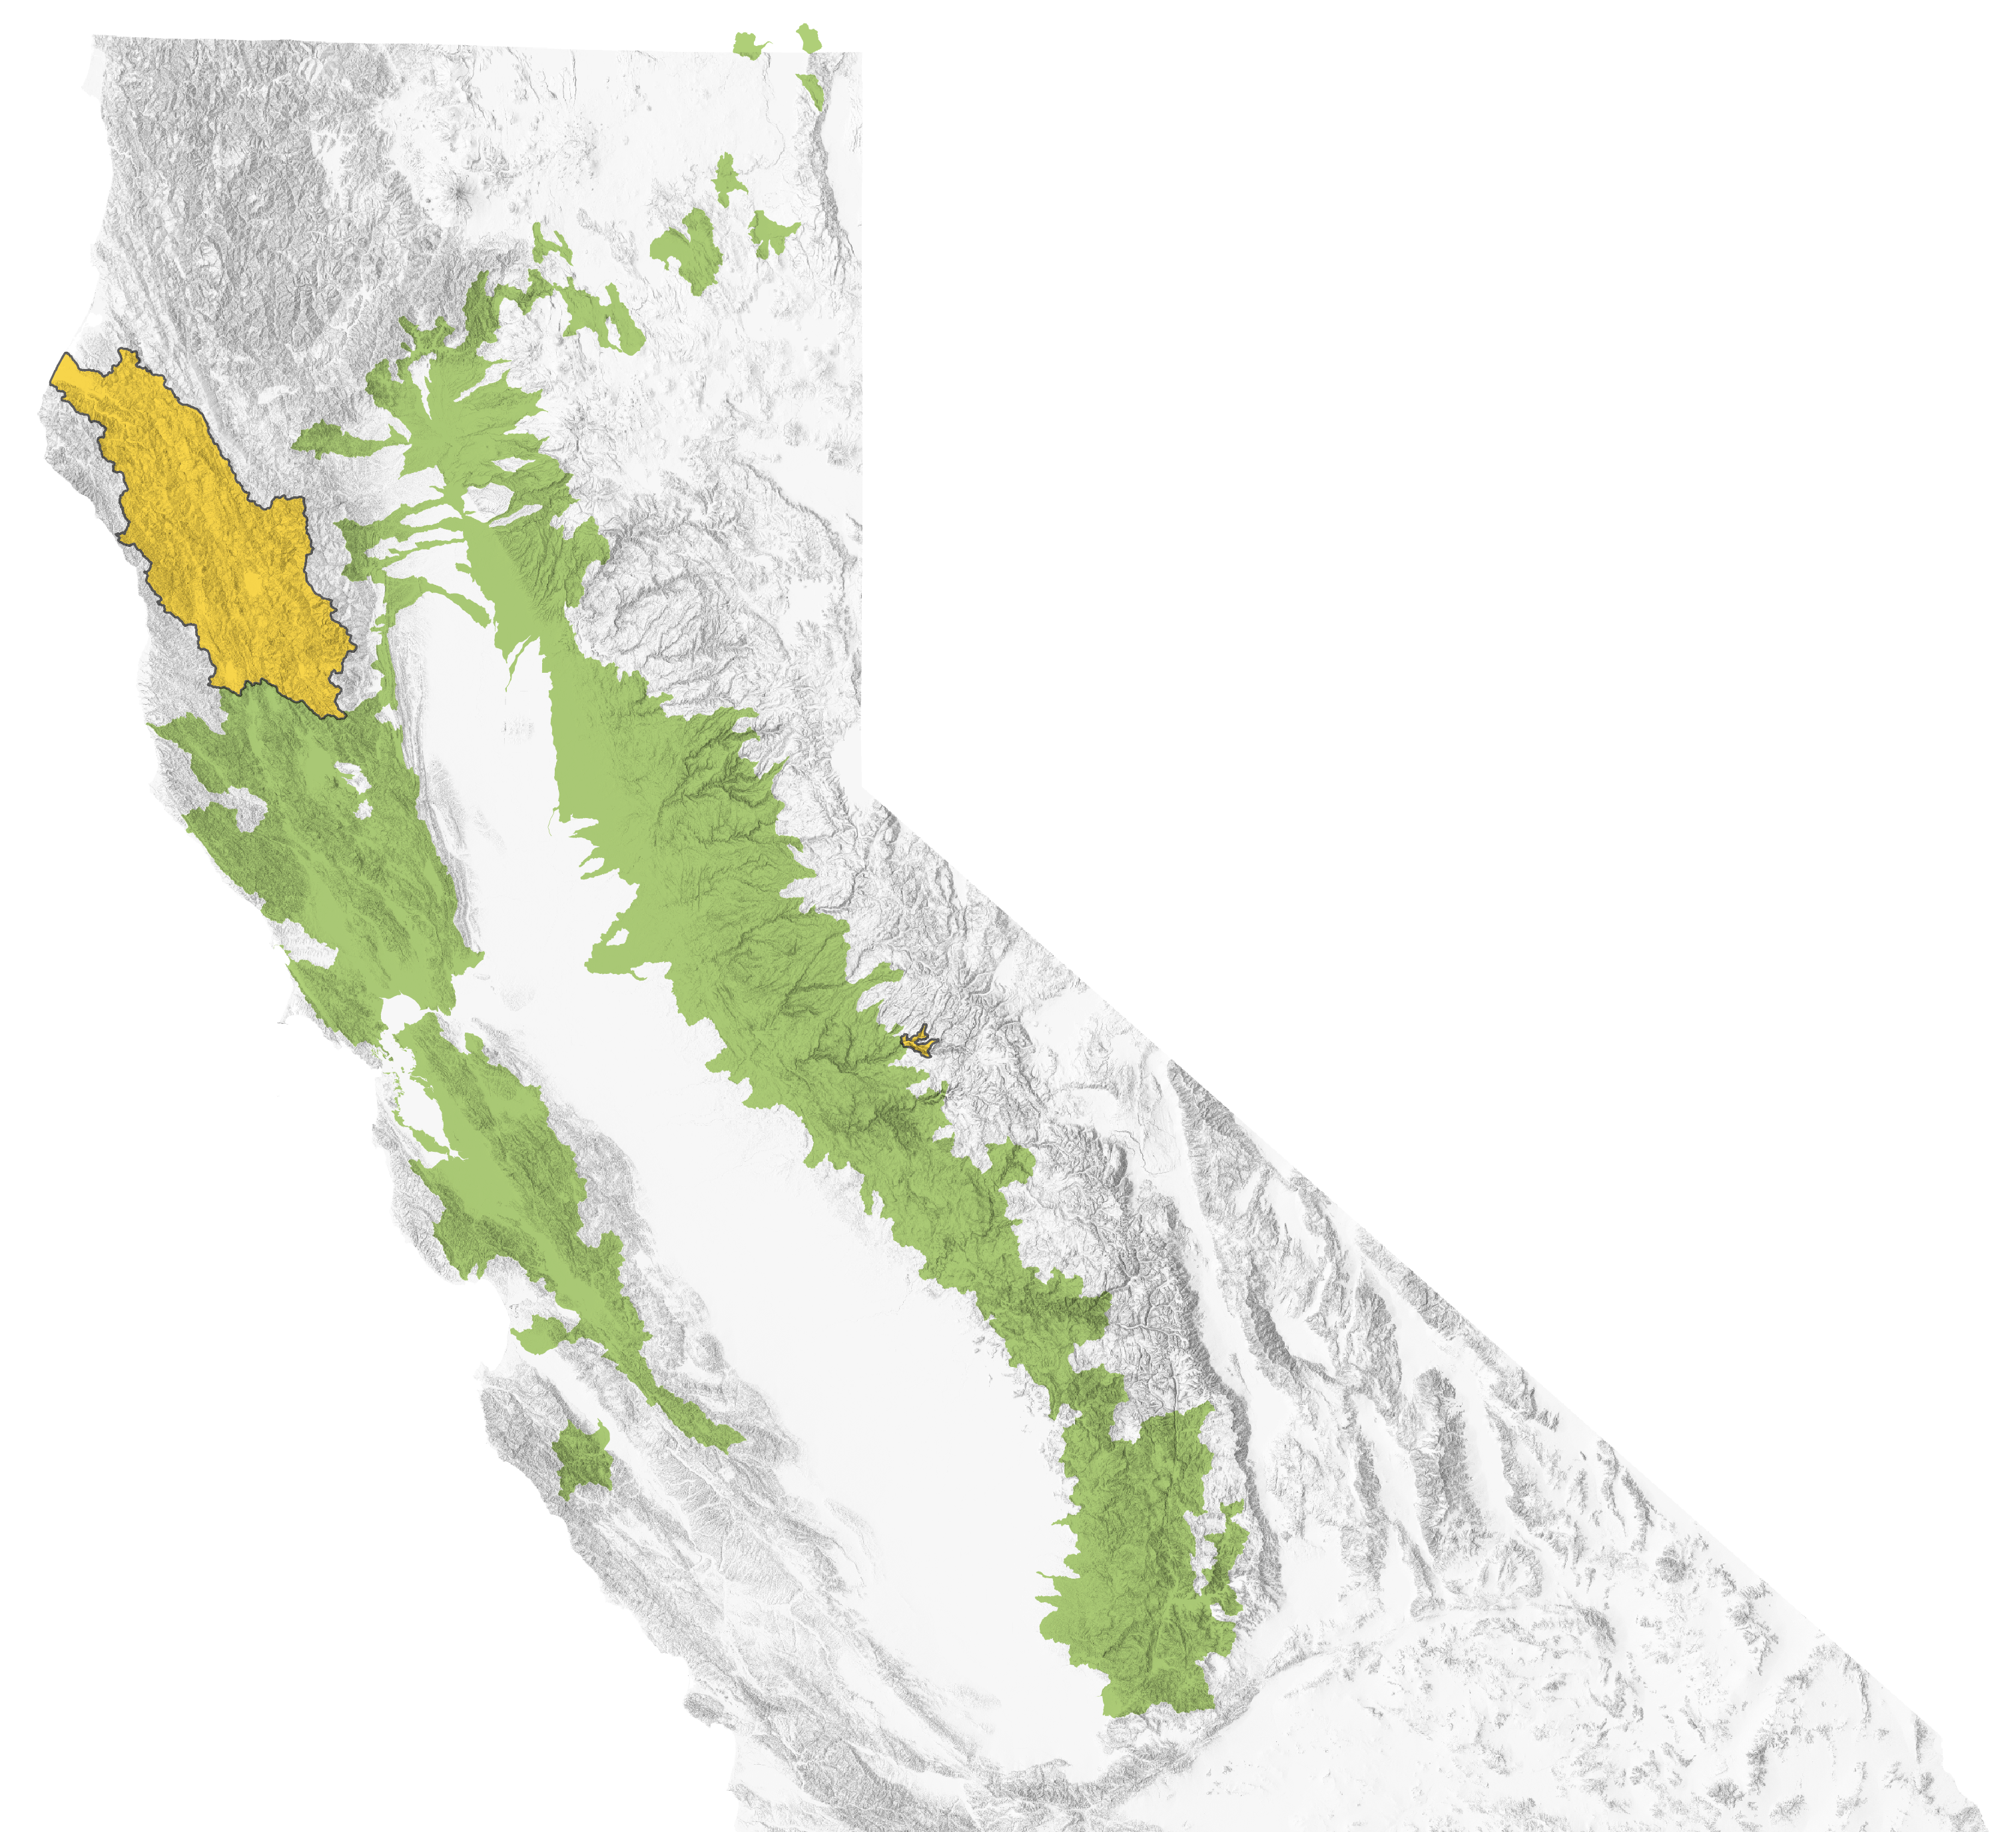
- Final map for publication
-
- ranges blended onto hillshade
-
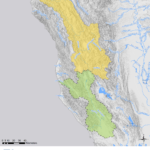
- Northern coastal roach range

-
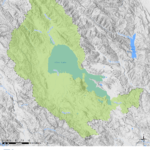
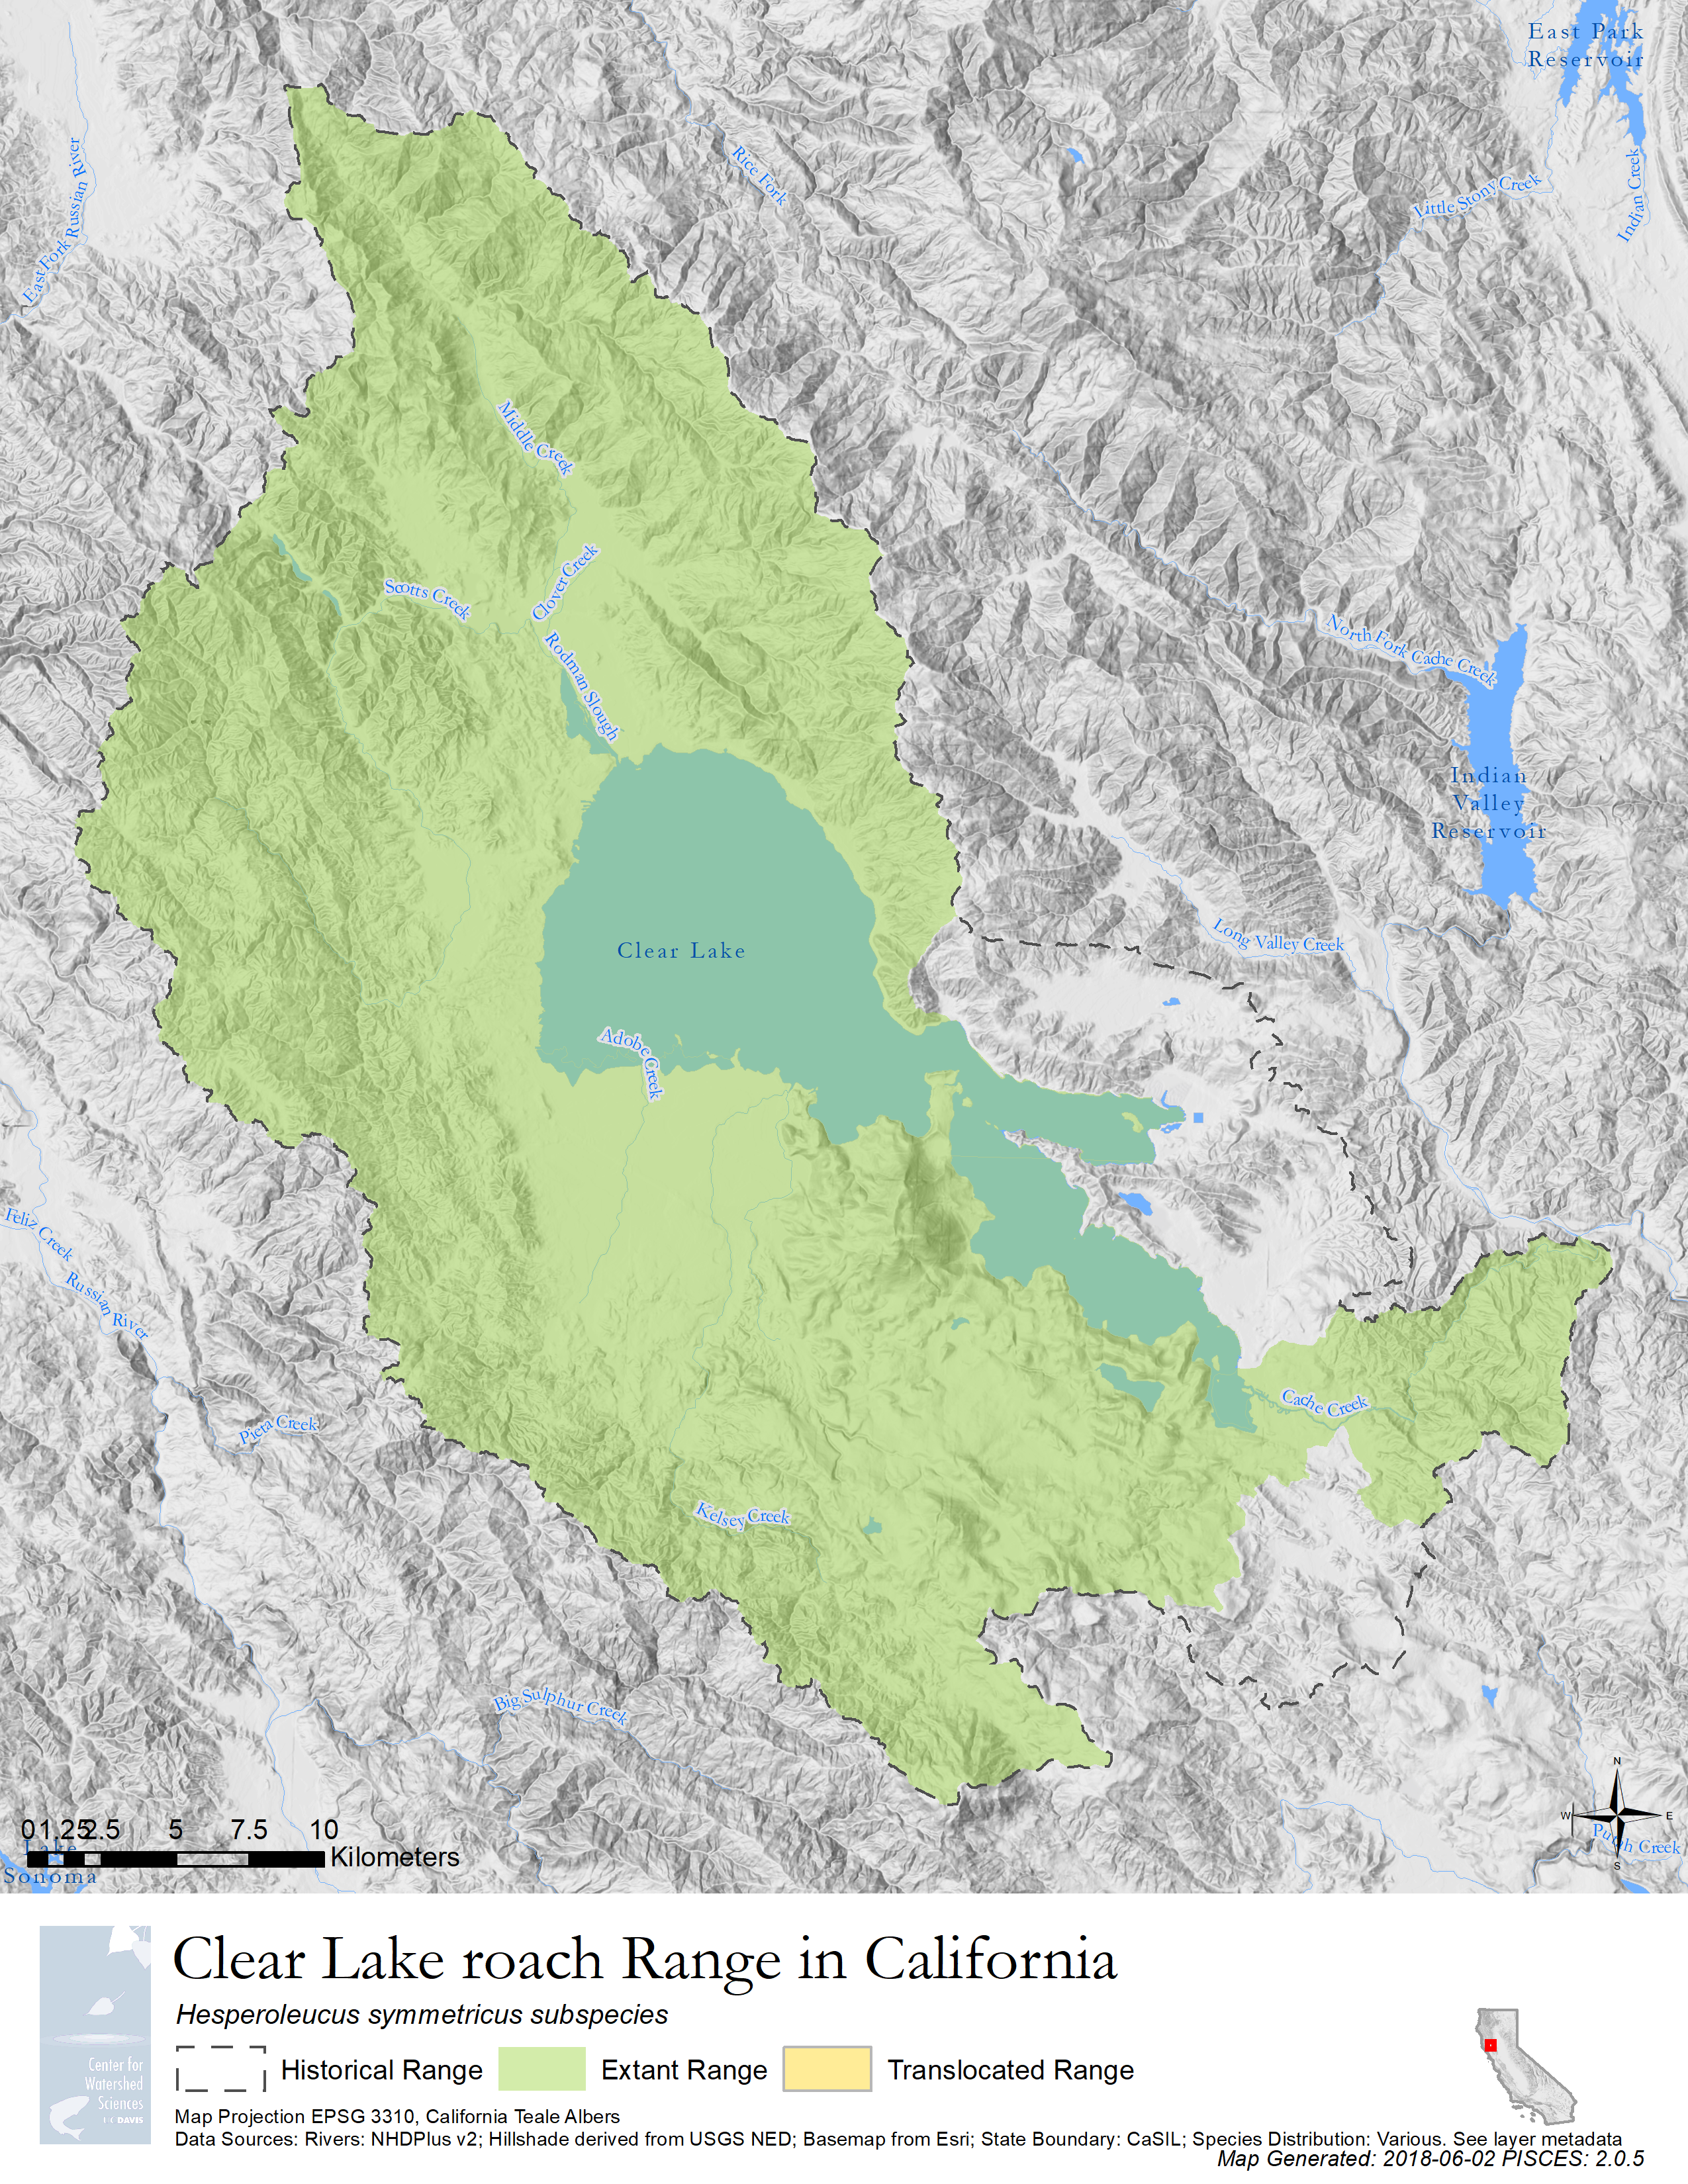
- Clear lake roach rnage
-
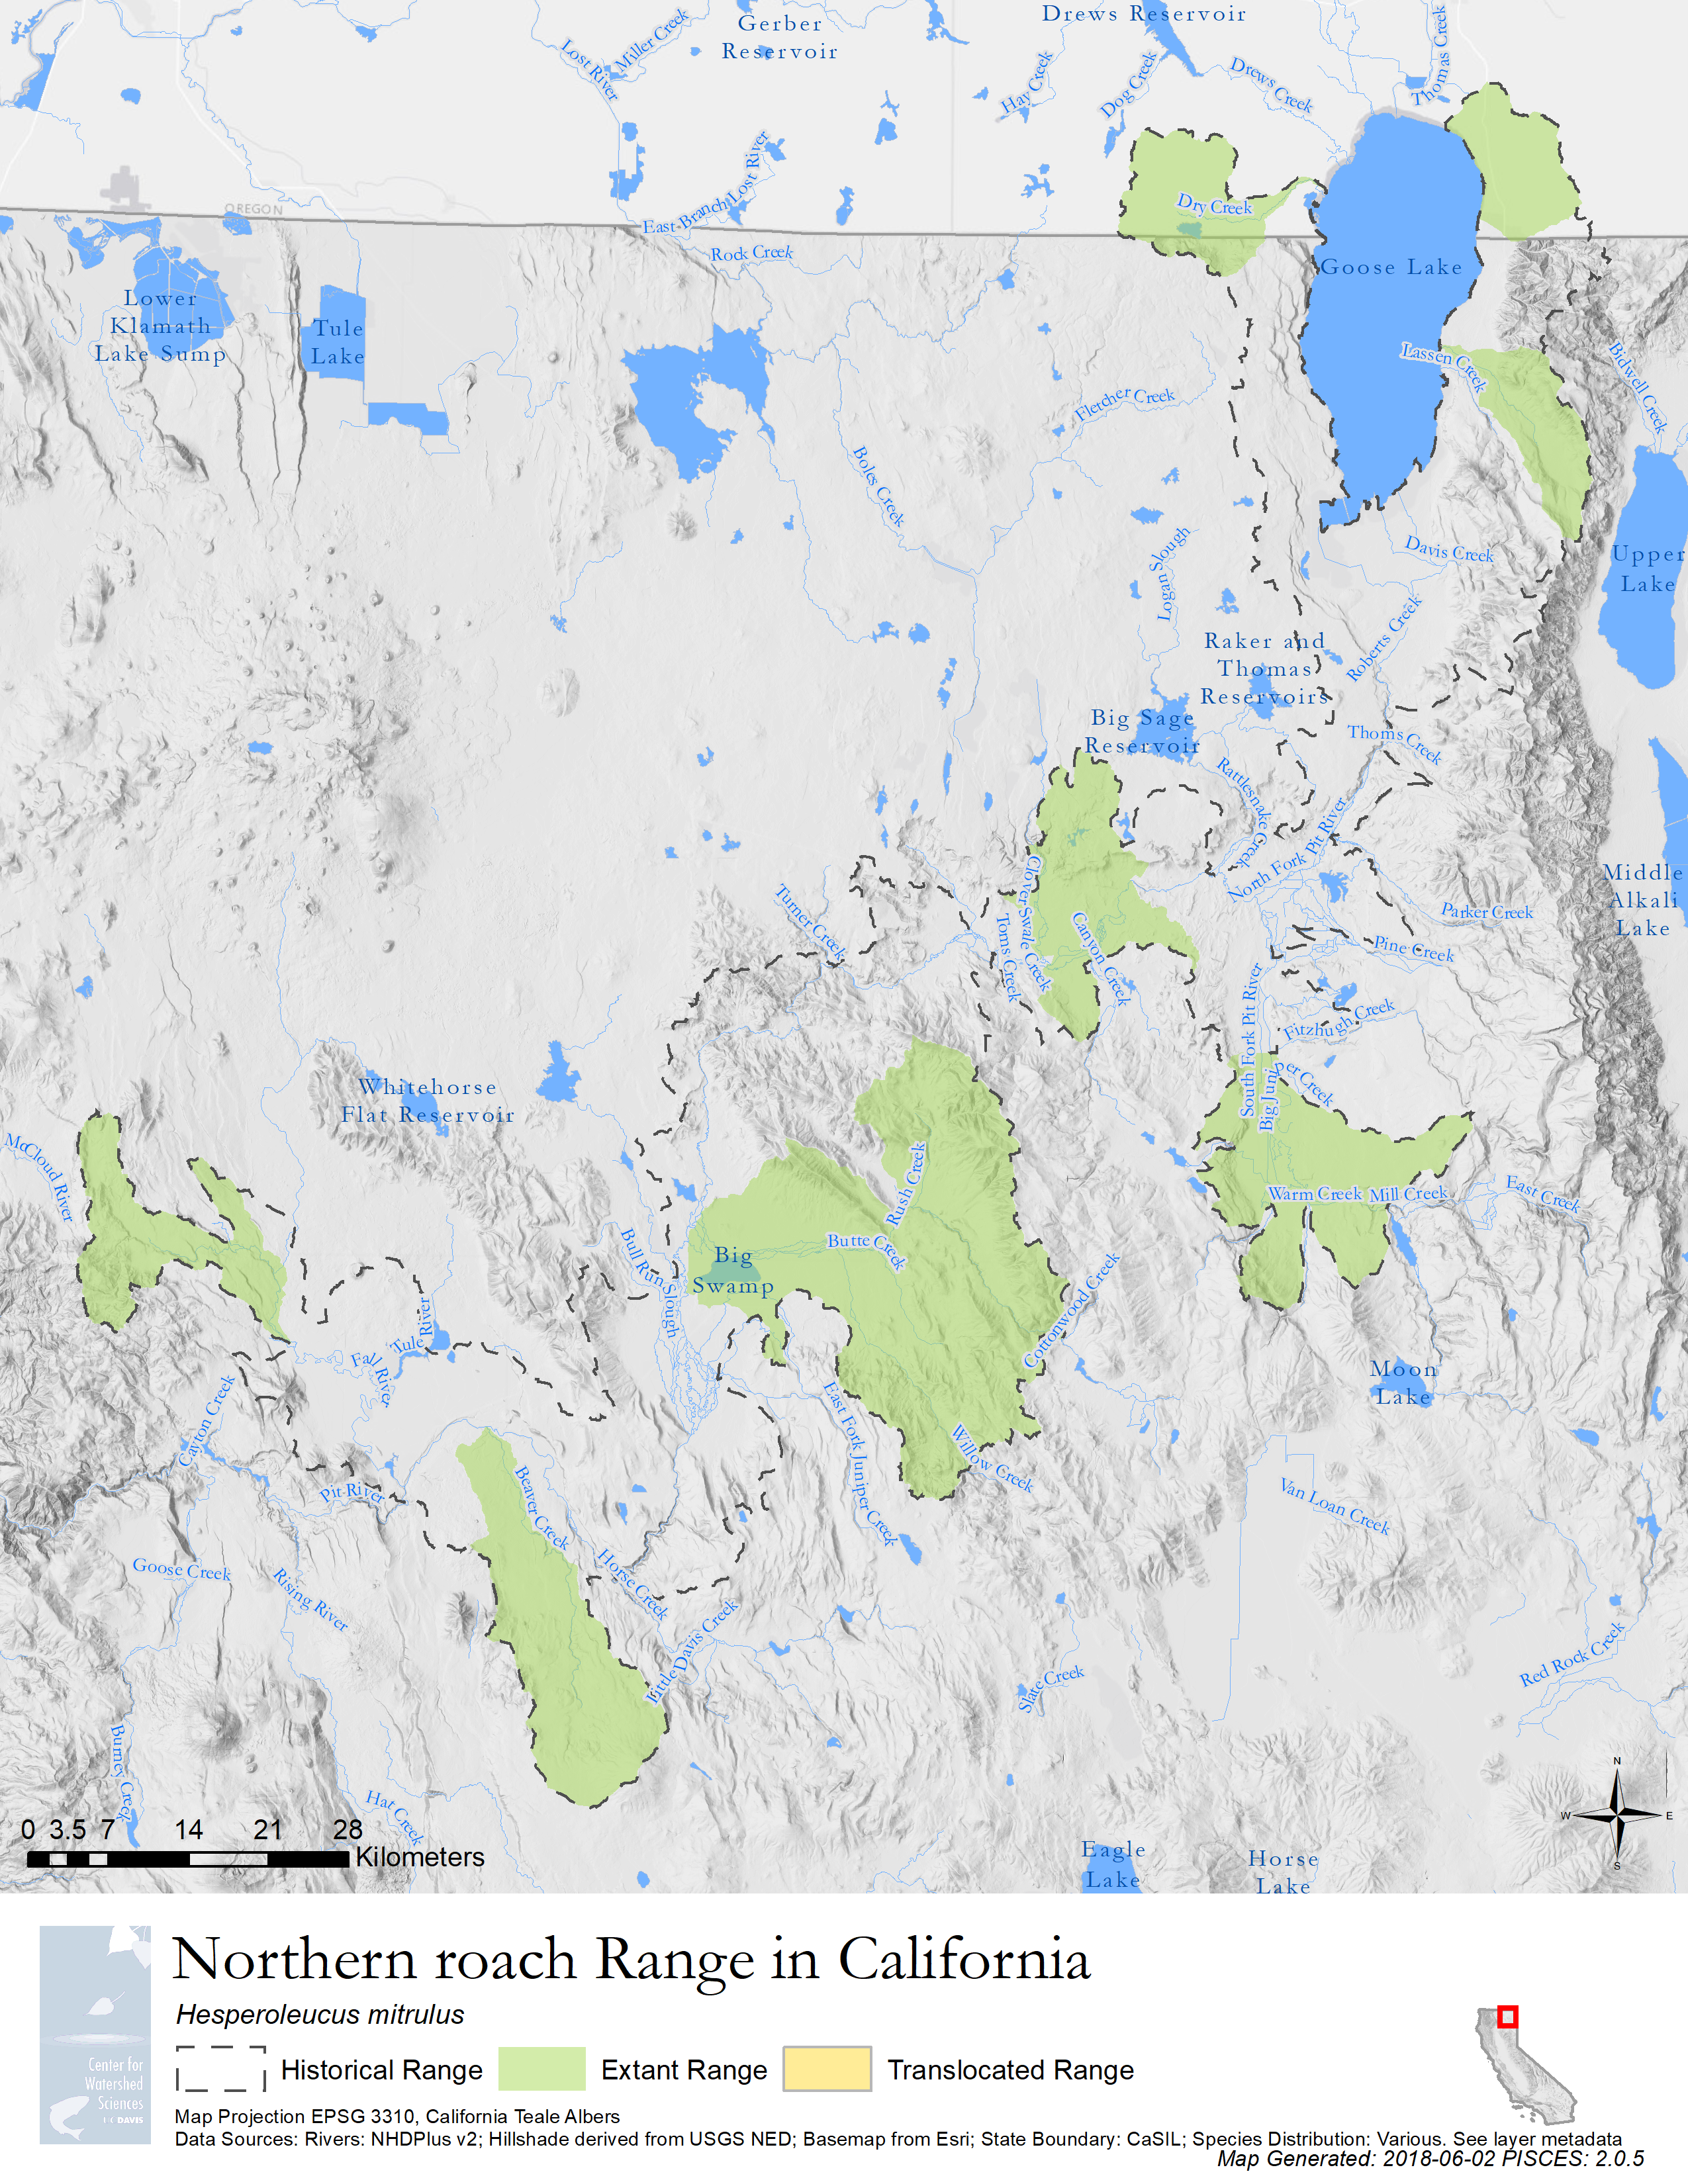
- Northern roach range
-
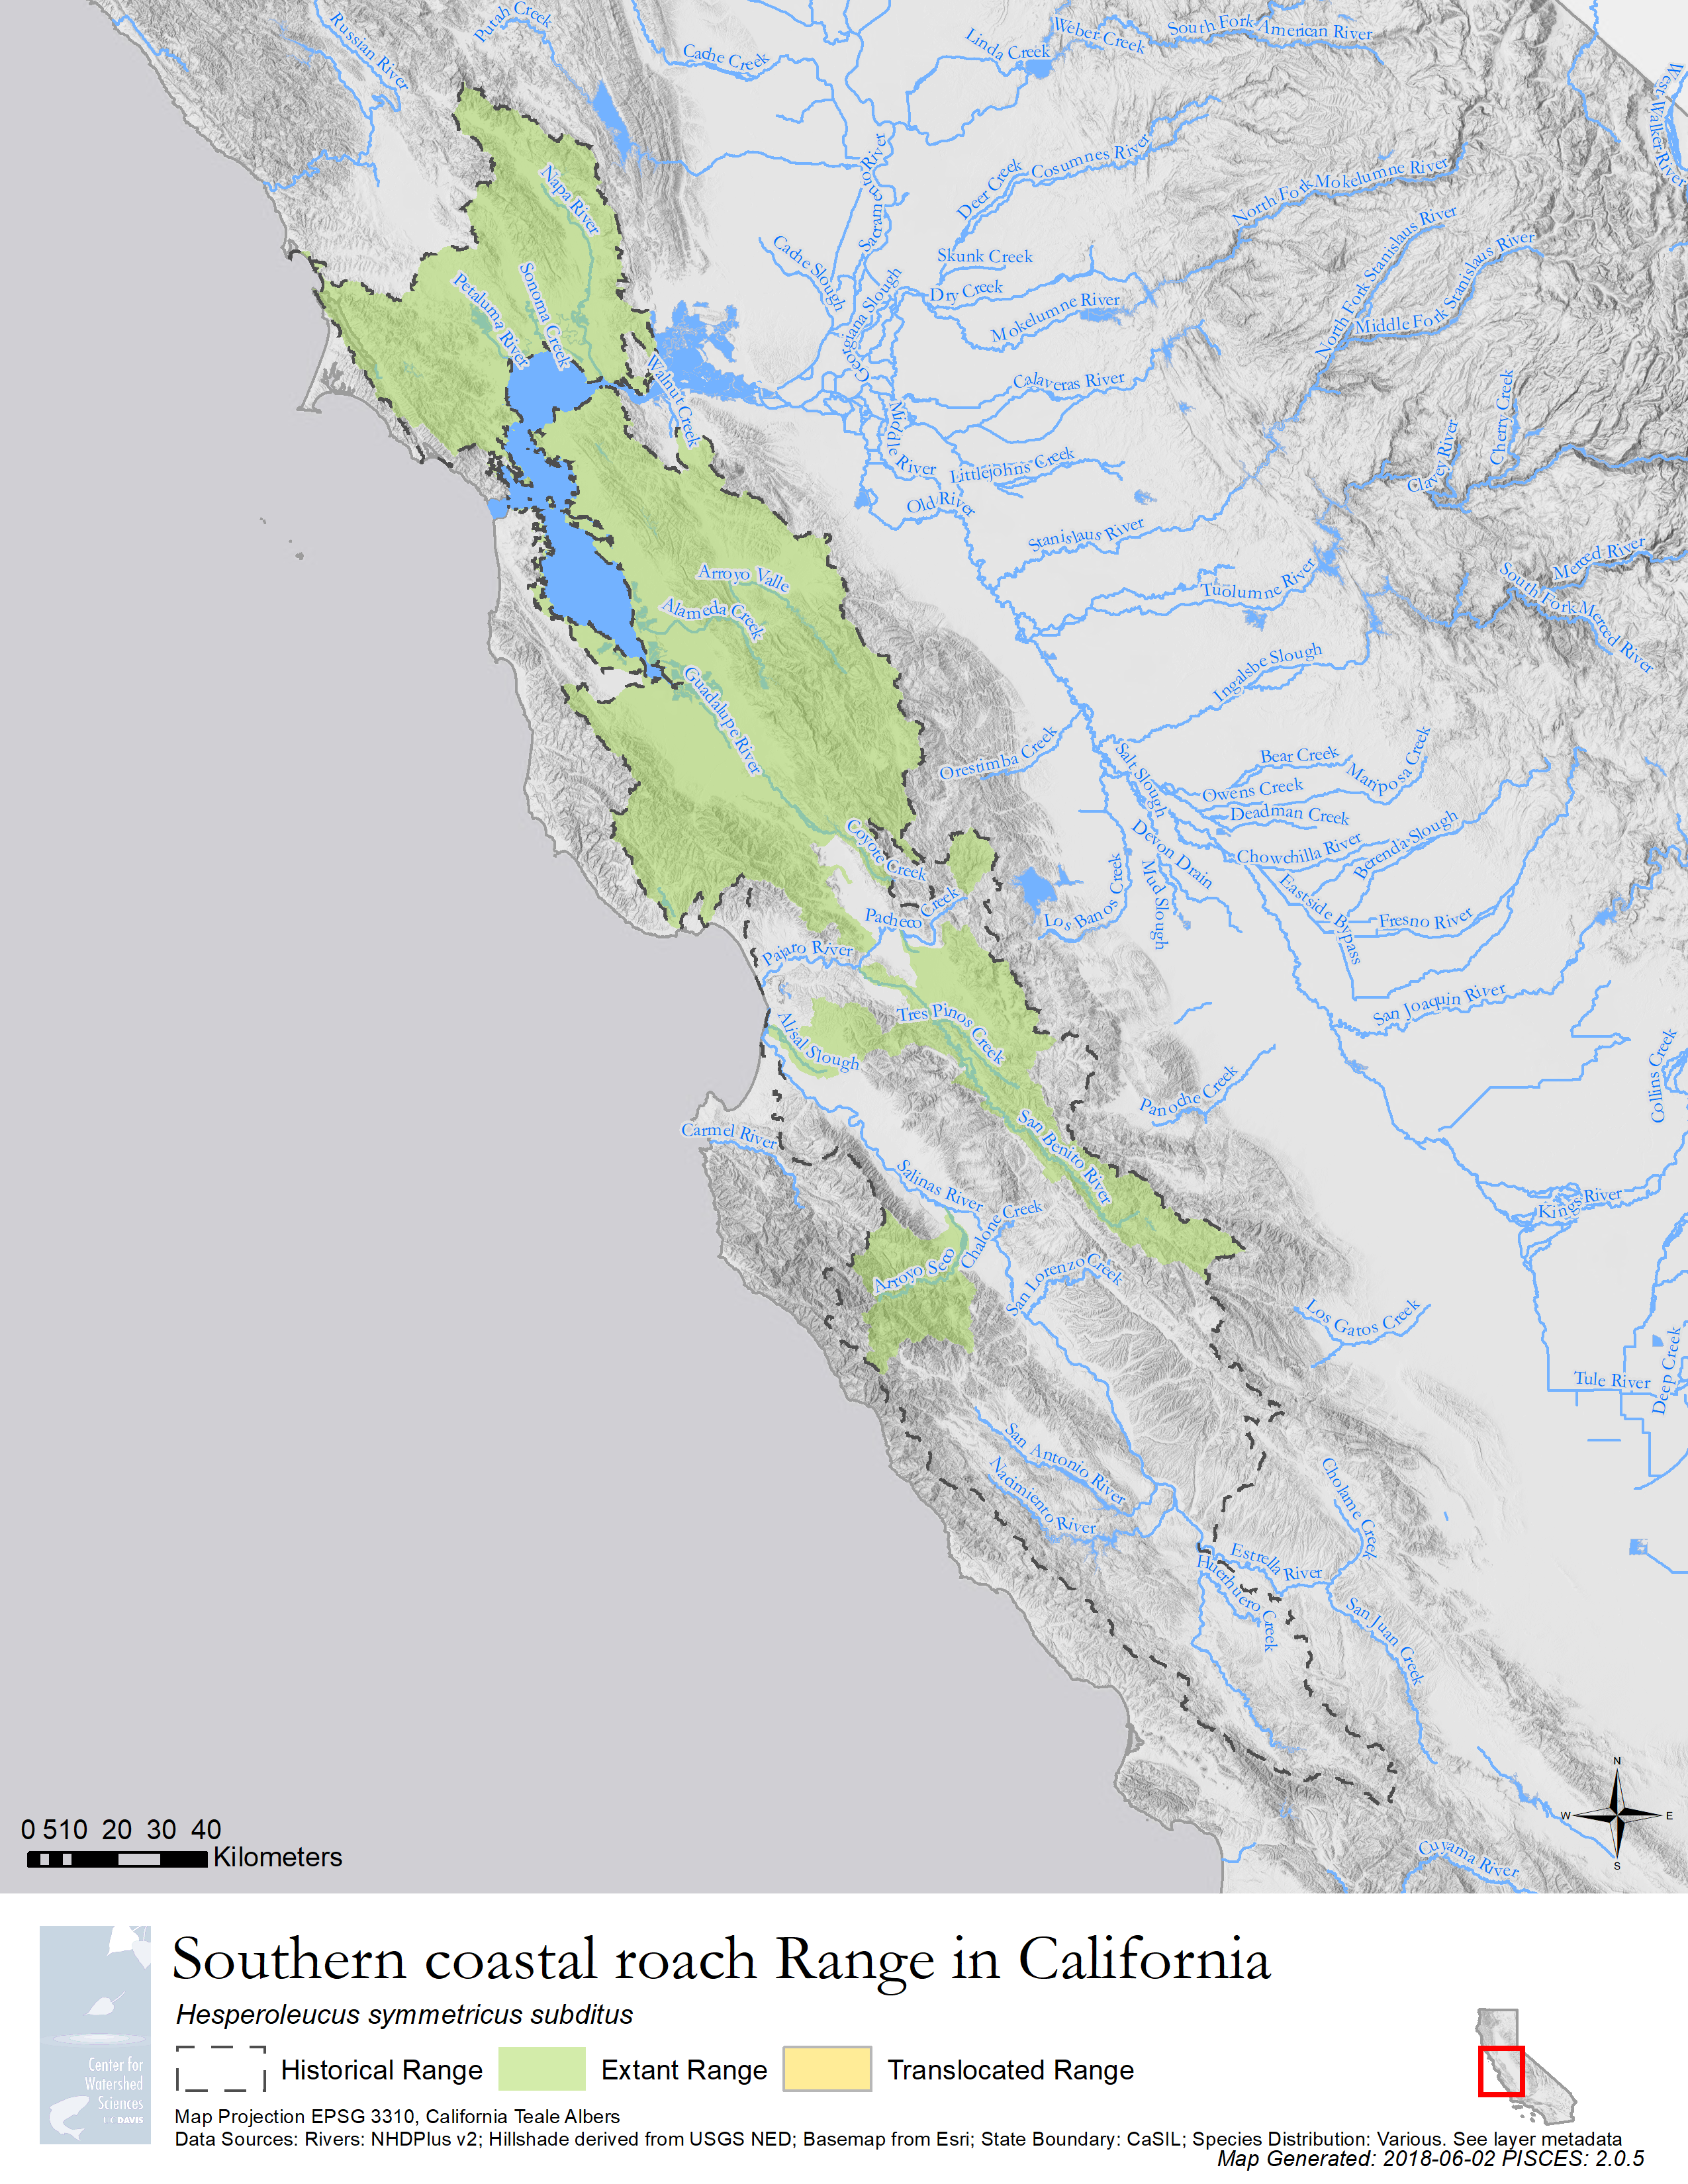
- Southern coastal roach range
-
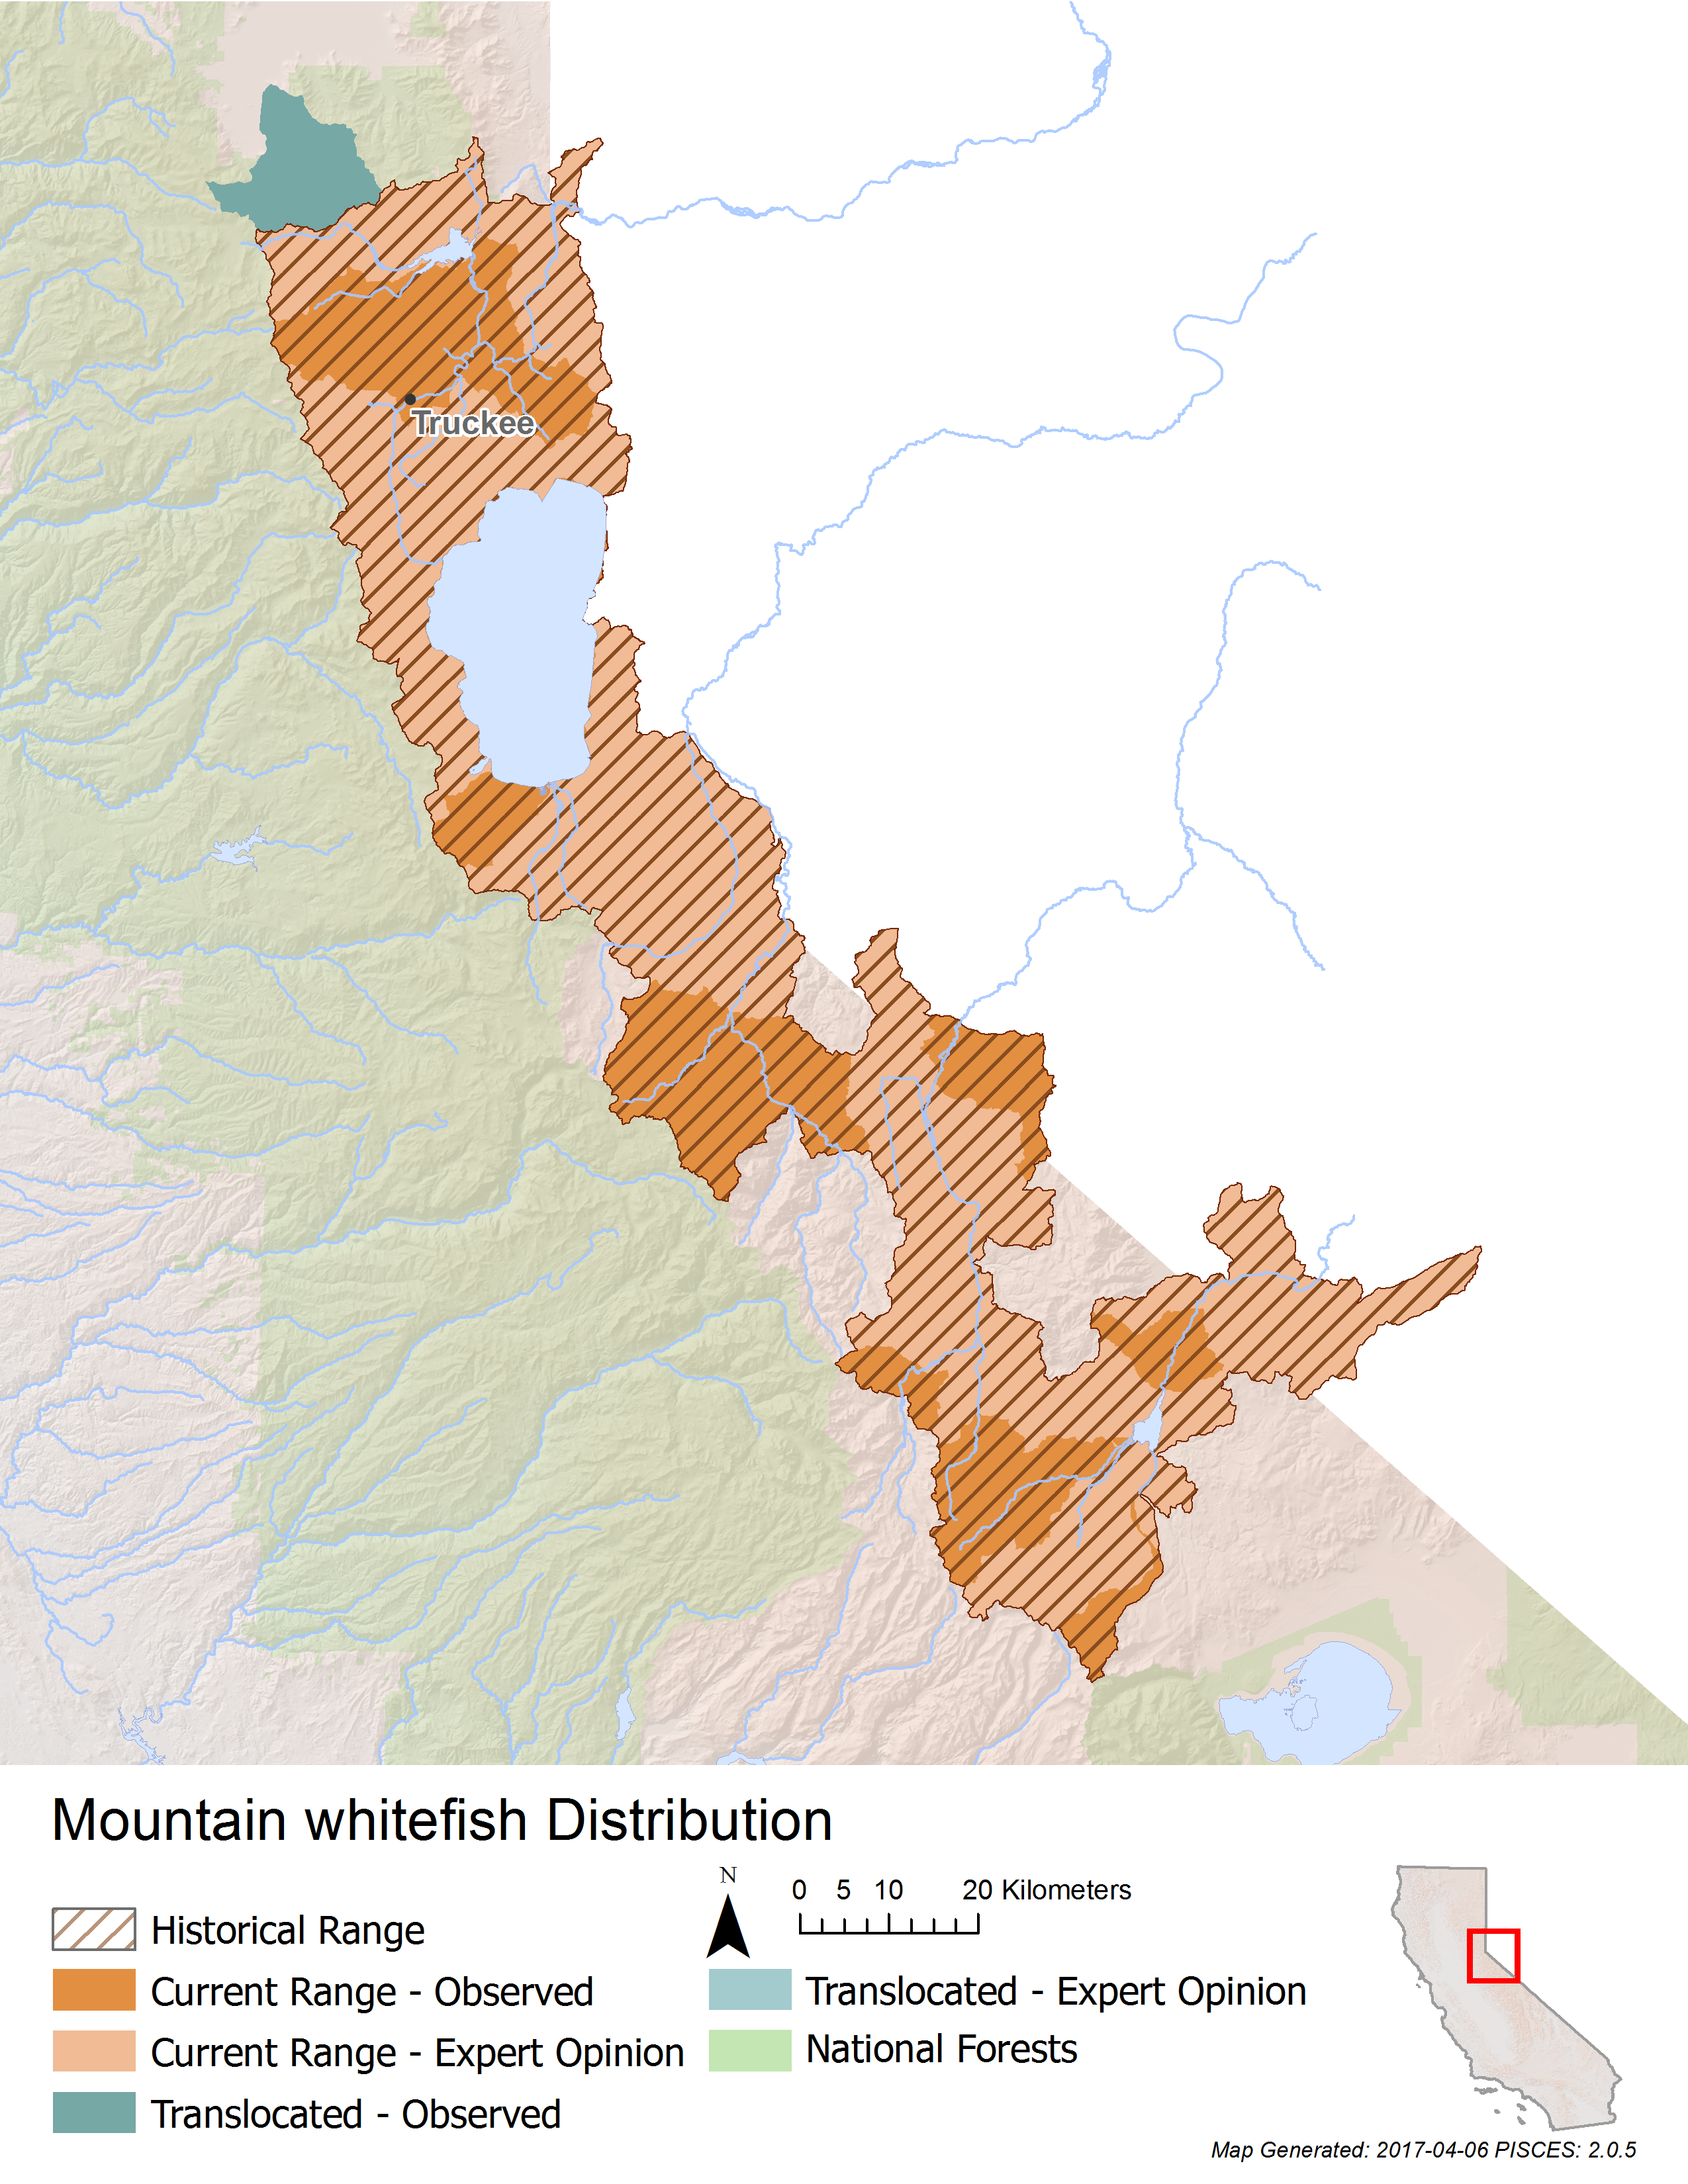
- Mountain whitefish range
-
- Northern California coast summer steelhead range
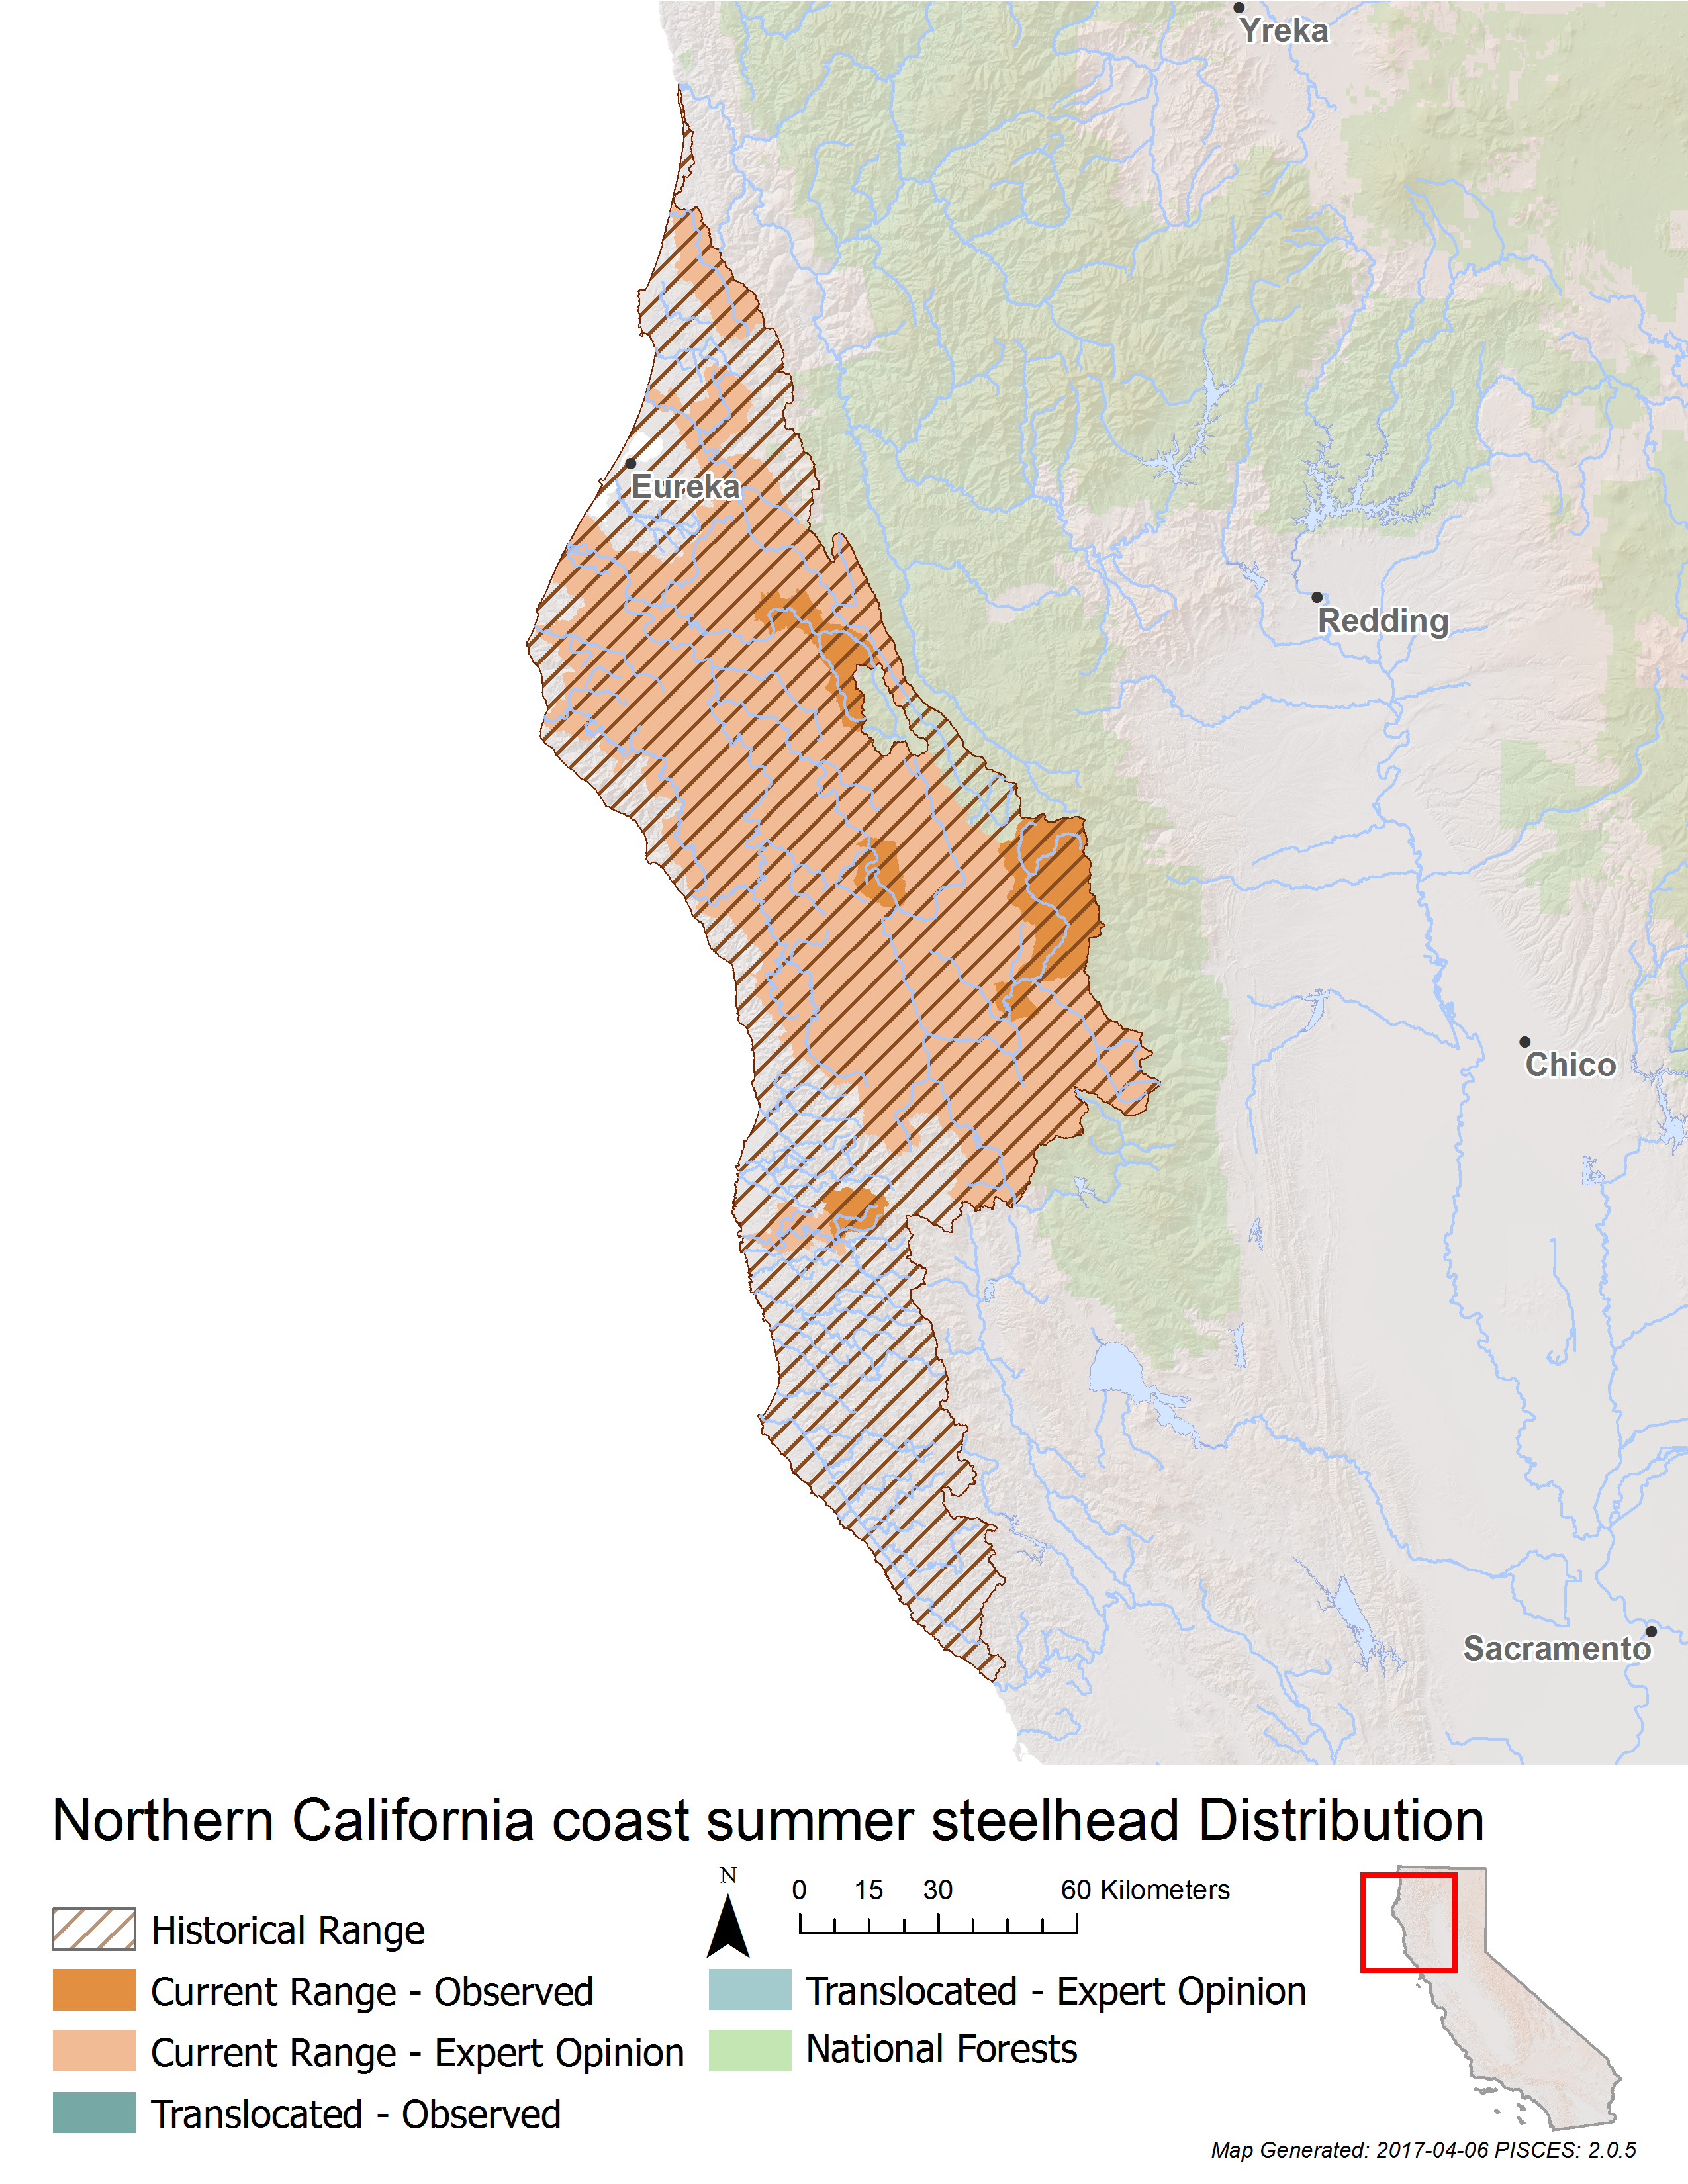
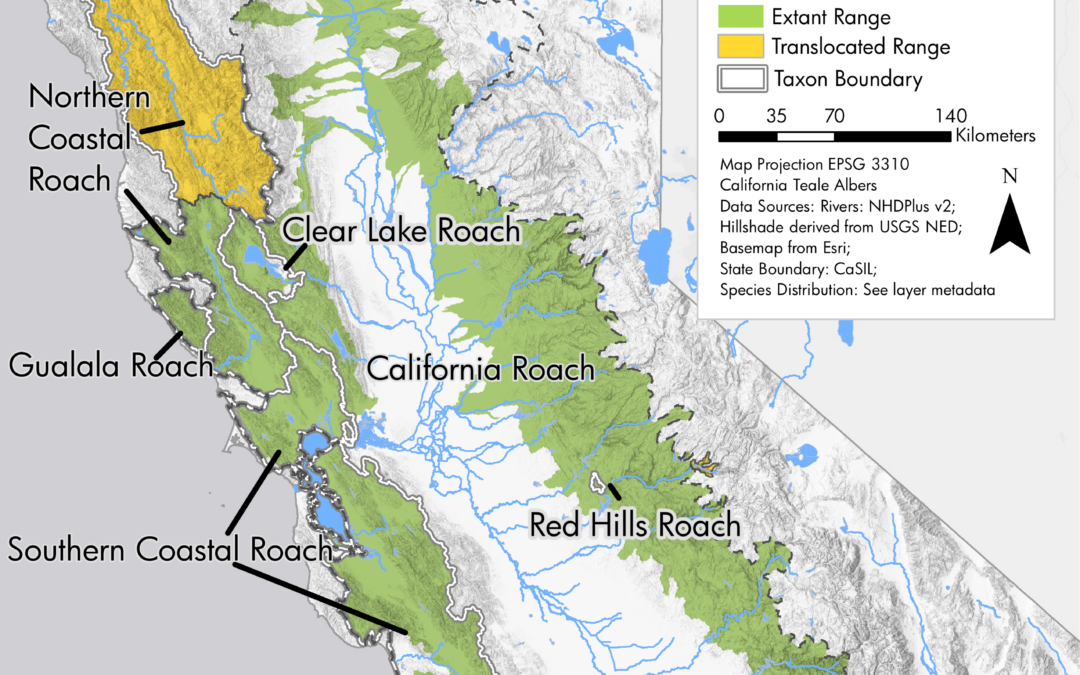
In 2017 and 2018, I utilized our PISCES software to generate new maps for CalTrout’s State of the Salmonids II: Fish in Hot Water (SOS II) report and for a new division of roach species and subspecies (genus Hesperoleucus).
For the SOS II report, we chose design and colors to match the color scheme of the report itself, made range updates to reflect the best available information, and combined layers to more clearly mark species range. We delivered vector files for each species to the report’s designer where title and legend were removed and included elsewhere on the page. The final report can be found on CalTrout’s website.
For the roach species maps, we wanted to simplify the data display – we collapsed similar categories so that there were only three presence types – current native range, current translocated range, and historical range. We chose semi-transparent green for native range, semi-transparent yellow for translocated range, and a dashed outline for historical range. These data were layered on a new six-direction hillshade with size-symbolized rivers and lakes that we developed as a basemap. We utilized both ArcGIS and QGIS in final map production in order to utilize layer blend modes in QGIS – the rangemaps use a “multiply” blend mode to create a more natural draping effect on the hillshade. The final map was used in “A reappraisal of the California Roach/Hitch (Cypriniformes, Cyprinidae, Hesperoleucus/Lavinia) species complex” by Jason Baumstaiger and Peter Moyle.