by Nick | Aug 19, 2016 | Maps
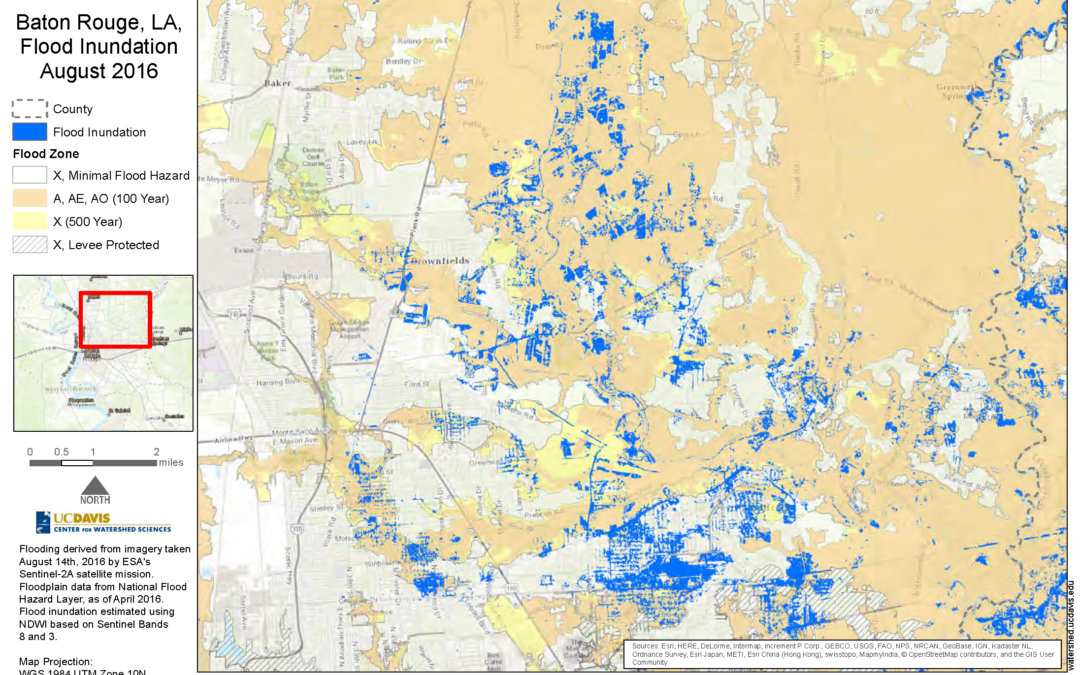
I created this static map as part of Nicholas Pinter’s Natural Hazards Mitigation Group’s analysis of flood inundation in the 2016 flooding in Baton Rouge, Louisiana. The corresponding interactive map can be found here.
by Nick | Aug 19, 2016 | Maps
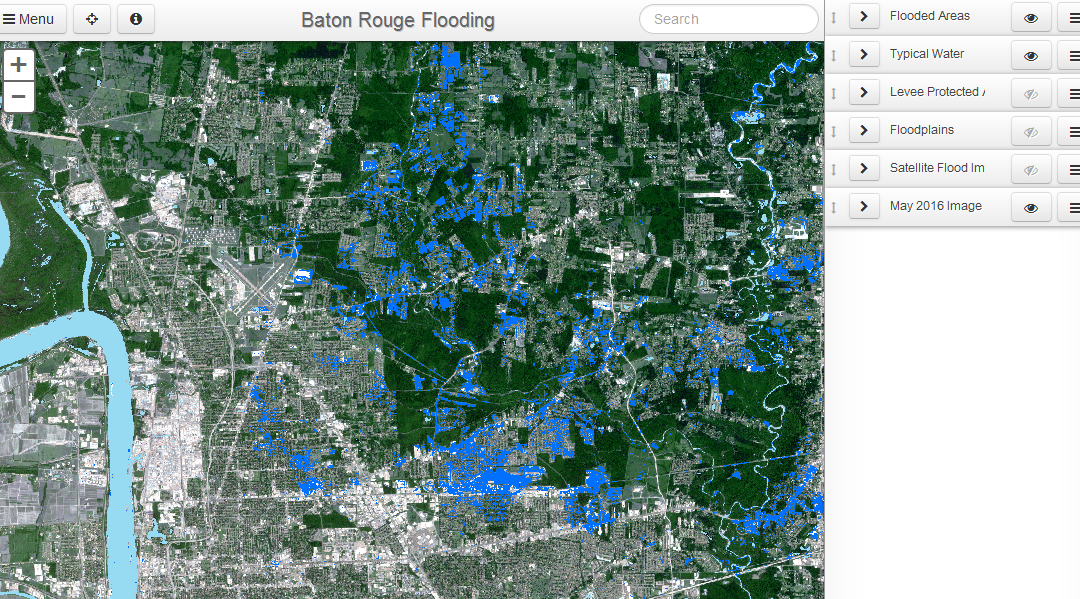
In response to flooding in Baton Rouge, Louisiana as a result of storms in August 2016, we detected flooding using satellite imagery to determine the extent of inundation as it compared to mapped floodplains. The darker blue shows flood inundation on Aug. 14, 2016,...
by Nick | Nov 30, 2015 | Maps
For this project, I guided a first time web mapper in how to present the data visually and how to implement that presentation in code. The map uses Leaflet and D3 to provide interactive visualization of California economic data on agriculture at multiple spatial...
by Nick | Oct 11, 2015 | Maps
I built a web map viewer for the PISCES California fish species range data. The data is served by ArcGIS Server and the viewer is a mix of a coworker’s custom map viewer that uses the ArcGIS API and site-specific javascript coded by me. Launch the Map...
by Nick | Feb 27, 2015 | Code, Maps
PISCES is a set of ArcGIS tools and data for managing and analyzing the ranges of California’s 133 native fish taxa. Data is stored as a standard relational database, increasing the power over many typical GIS approaches, and allowing for a powerful mapping...
